Loading data from 2,765,771 emissions sources summarized from 744,678,997 assets.
News & Insights
Stay up to date on the latest from Climate TRACE as we share news, data, and insights that help the global community make meaningful climate action faster and easier.
February release 5.4.0 includes monthly emissions data through December 2025. Full 2025 year in review data show competing trends, with signs of clean energy adoption lowering emissions in key regions, while oil and gas sector emissions reached new heights.
This Climate TRACE Emissions Reduction Solution (ERS) spotlight focuses on methane reductions in rice cultivation, focusing on Thailand's NAMA Rice Farms.
This Climate TRACE Emissions Reduction Solution (ERS) spotlight focuses on the transition to electric vehicles in Shenzhen, China.
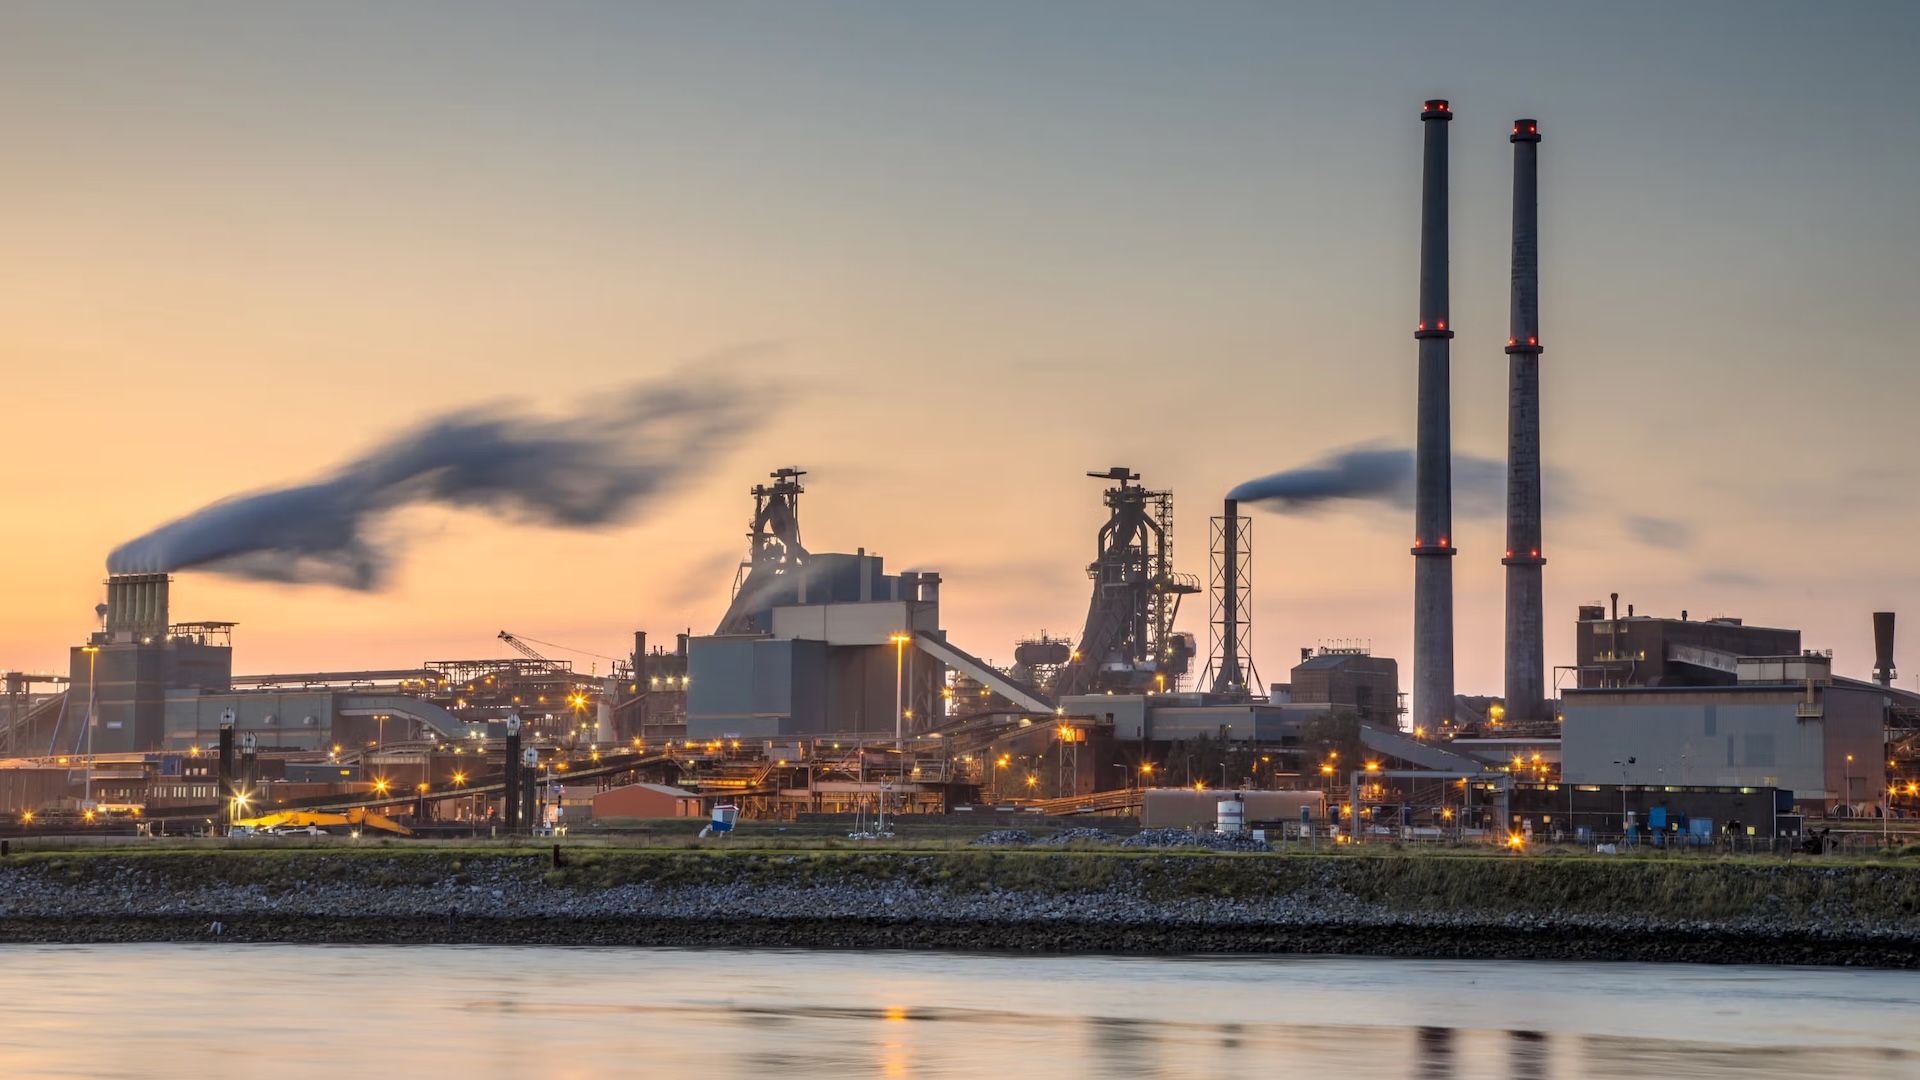
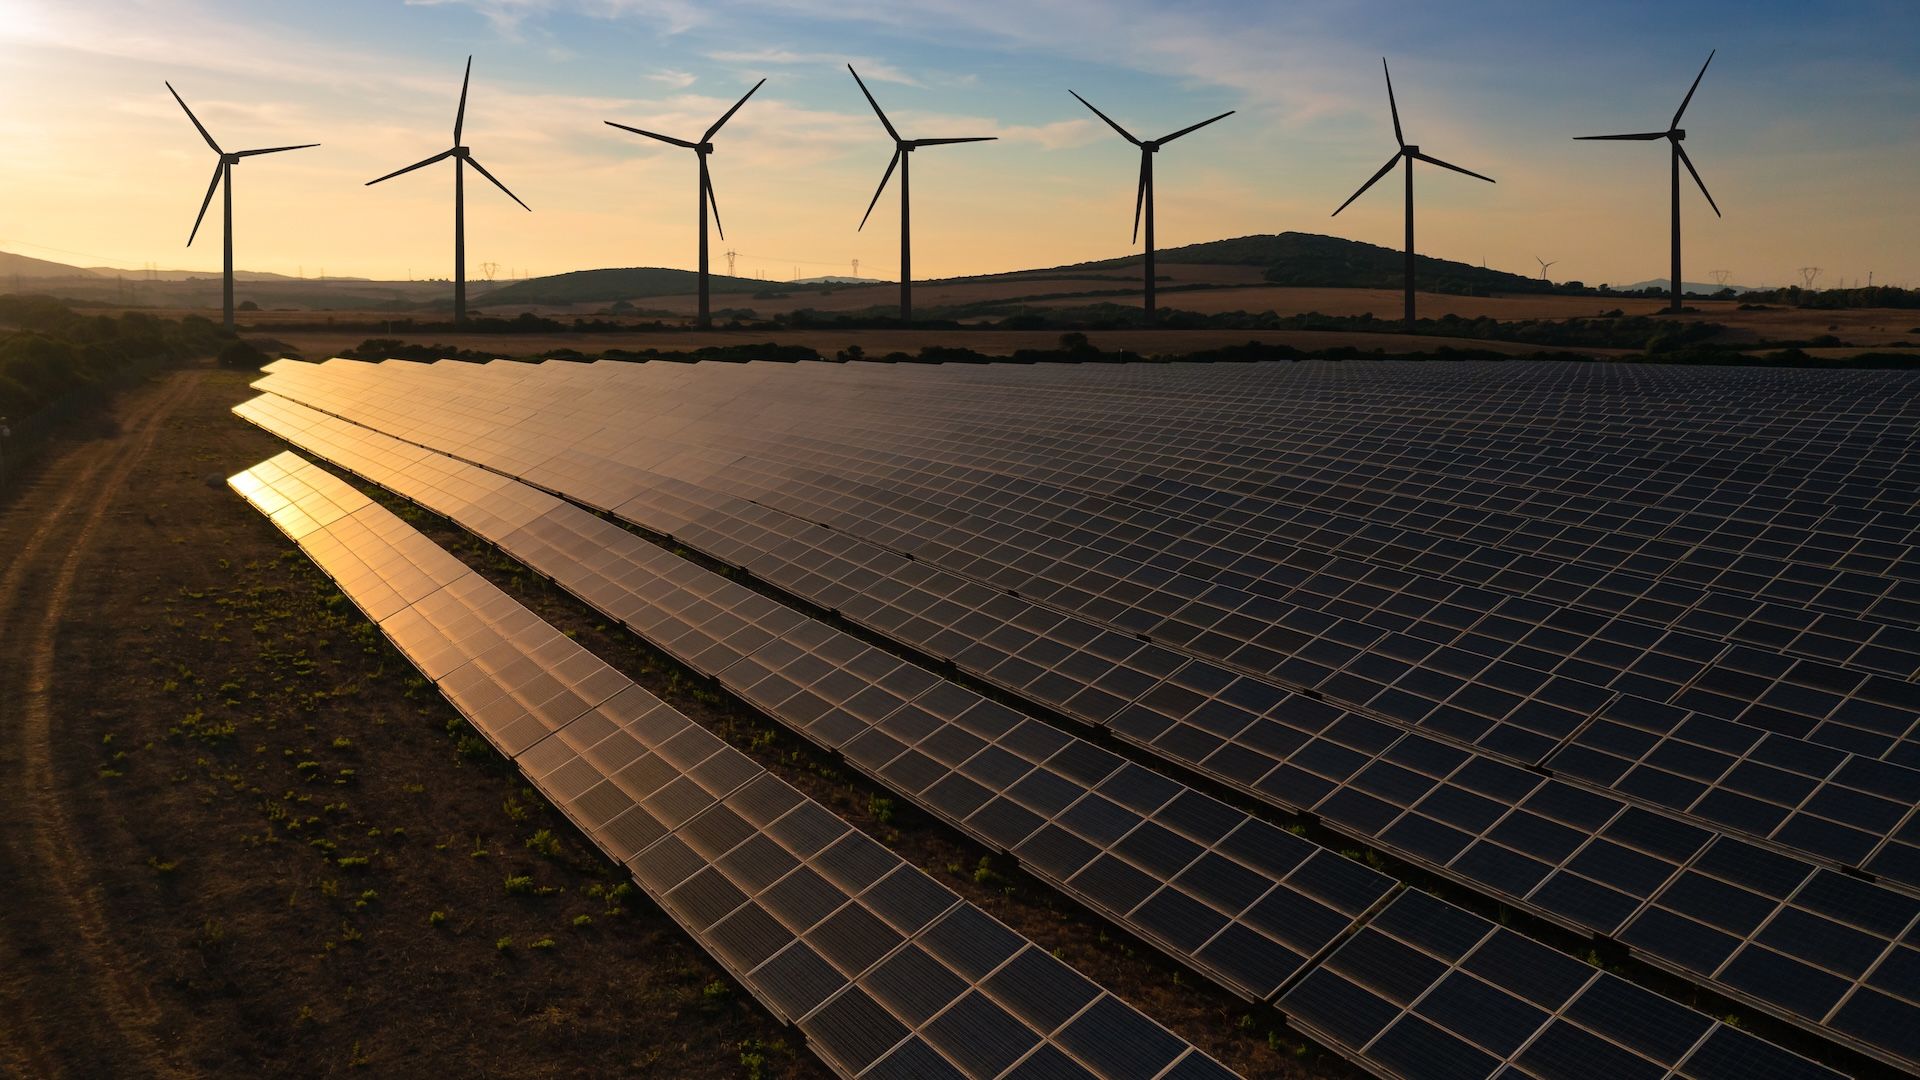
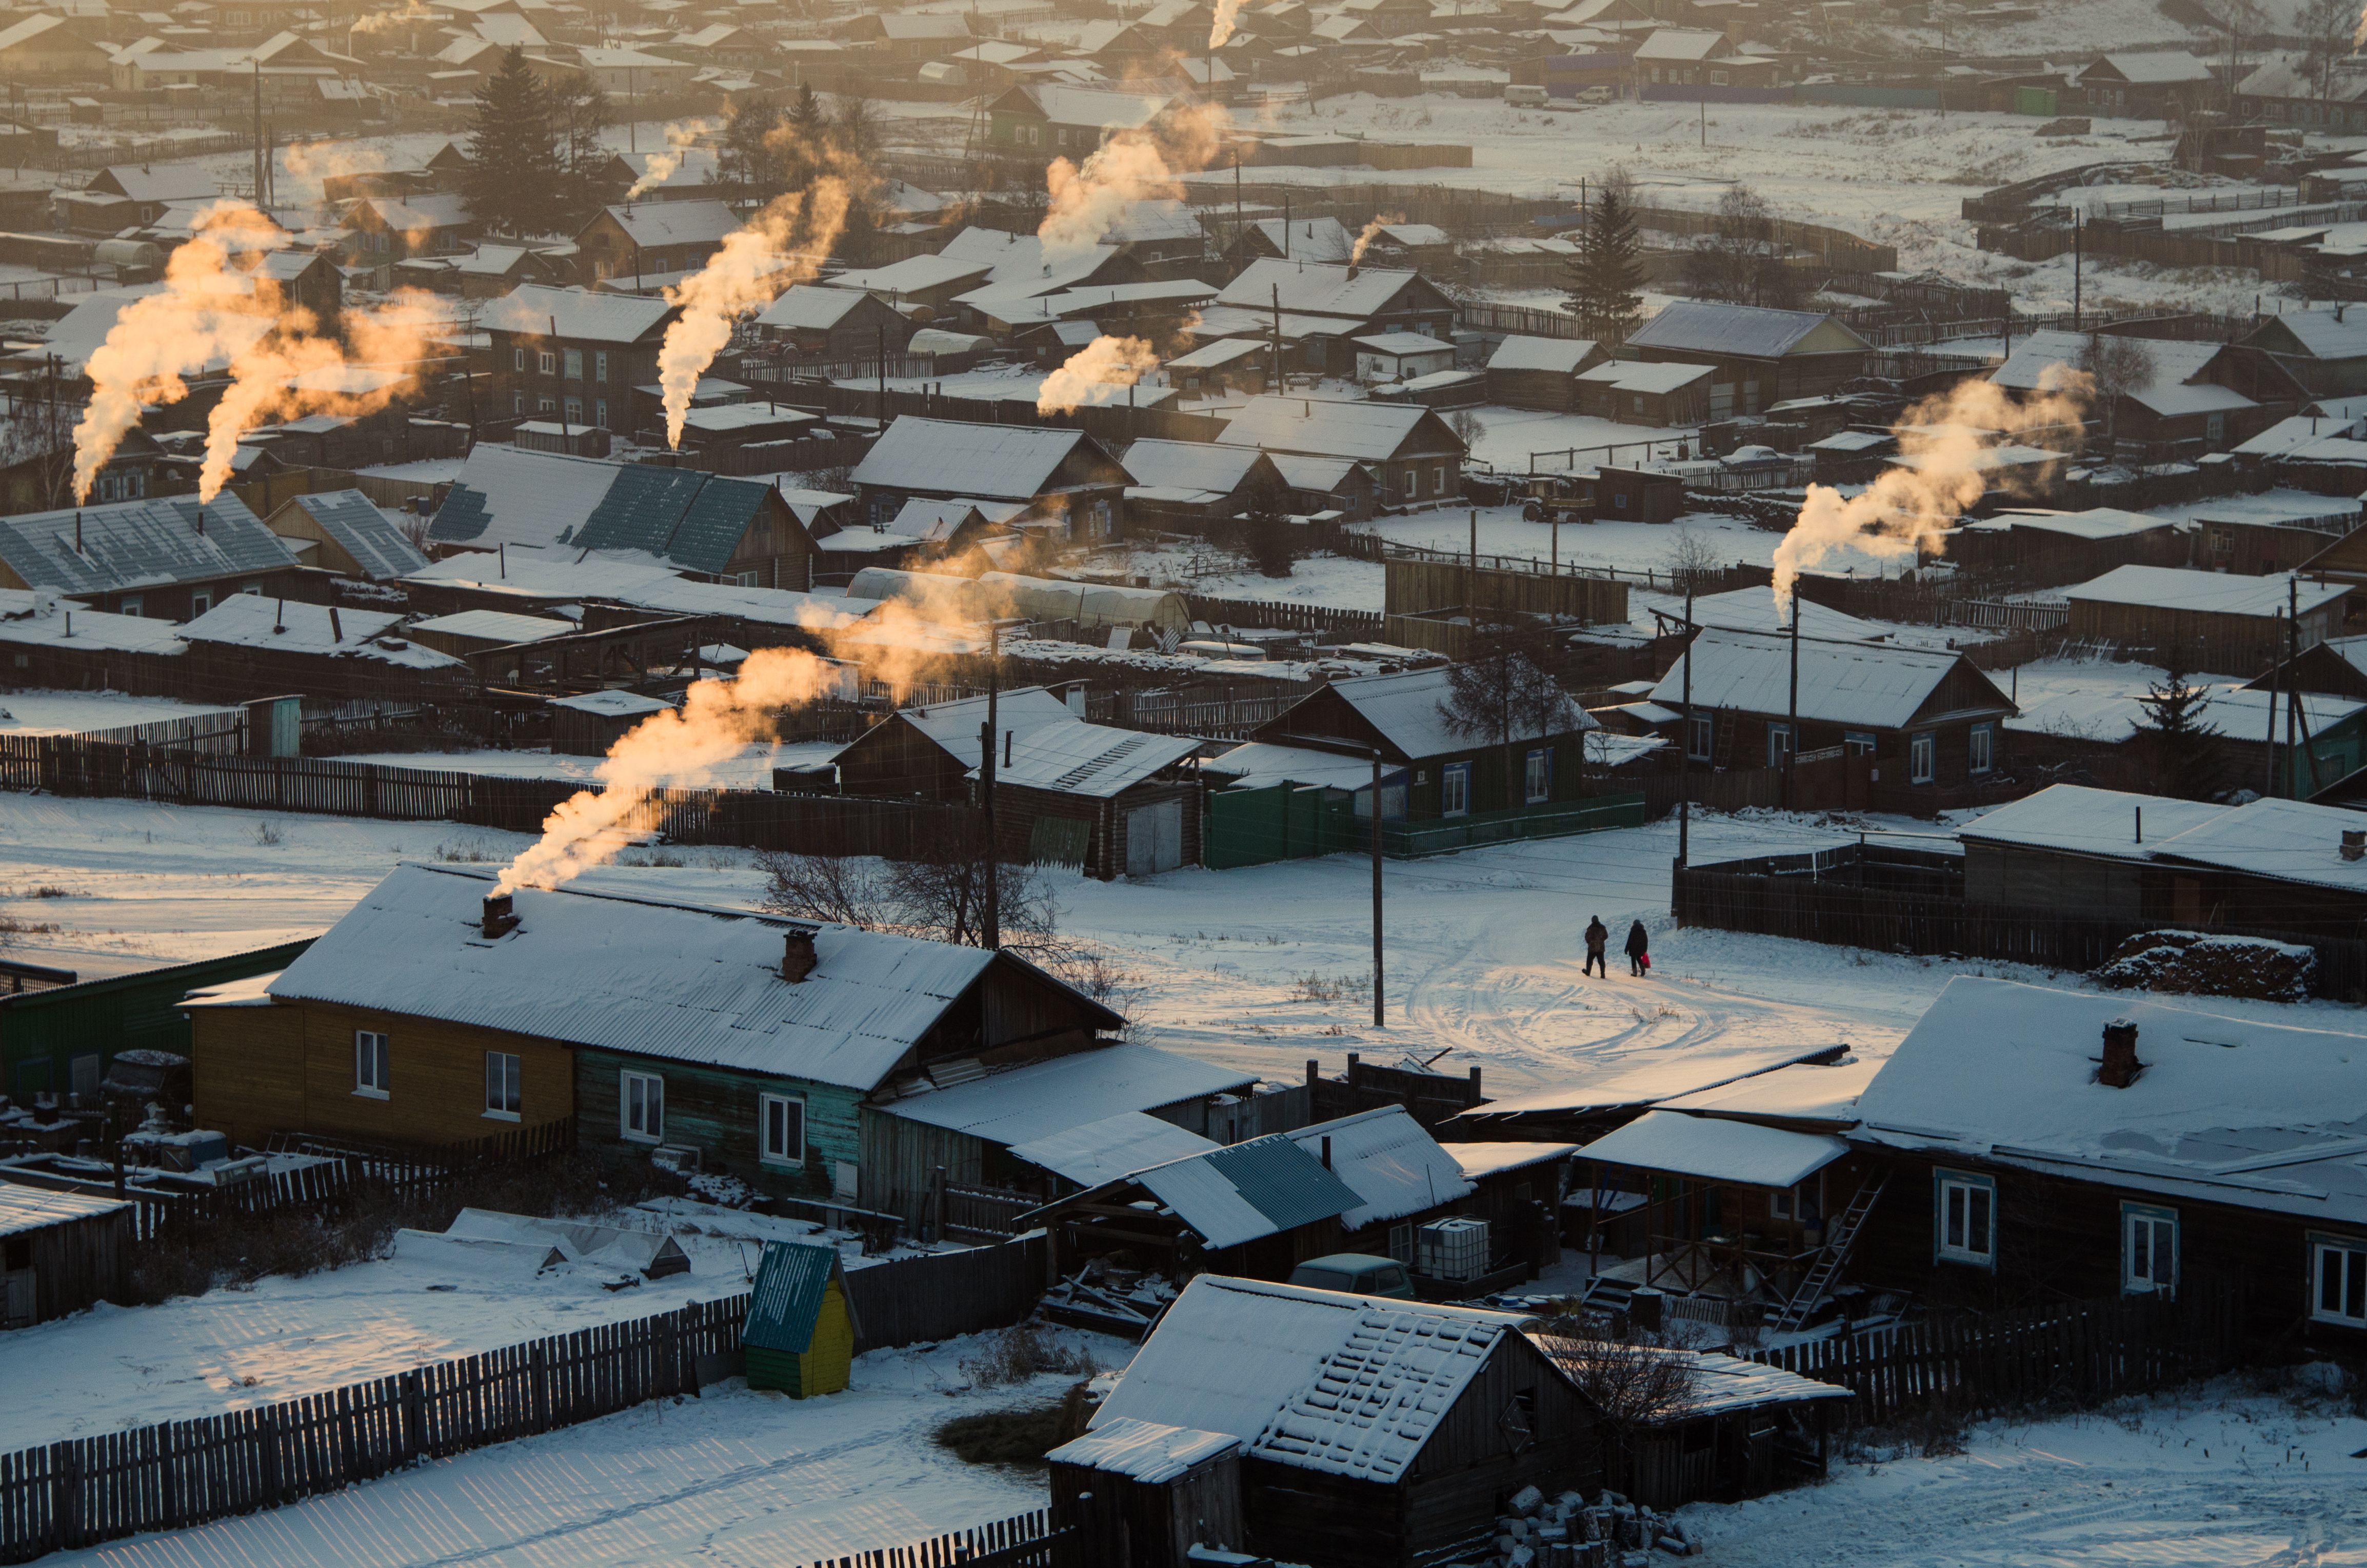
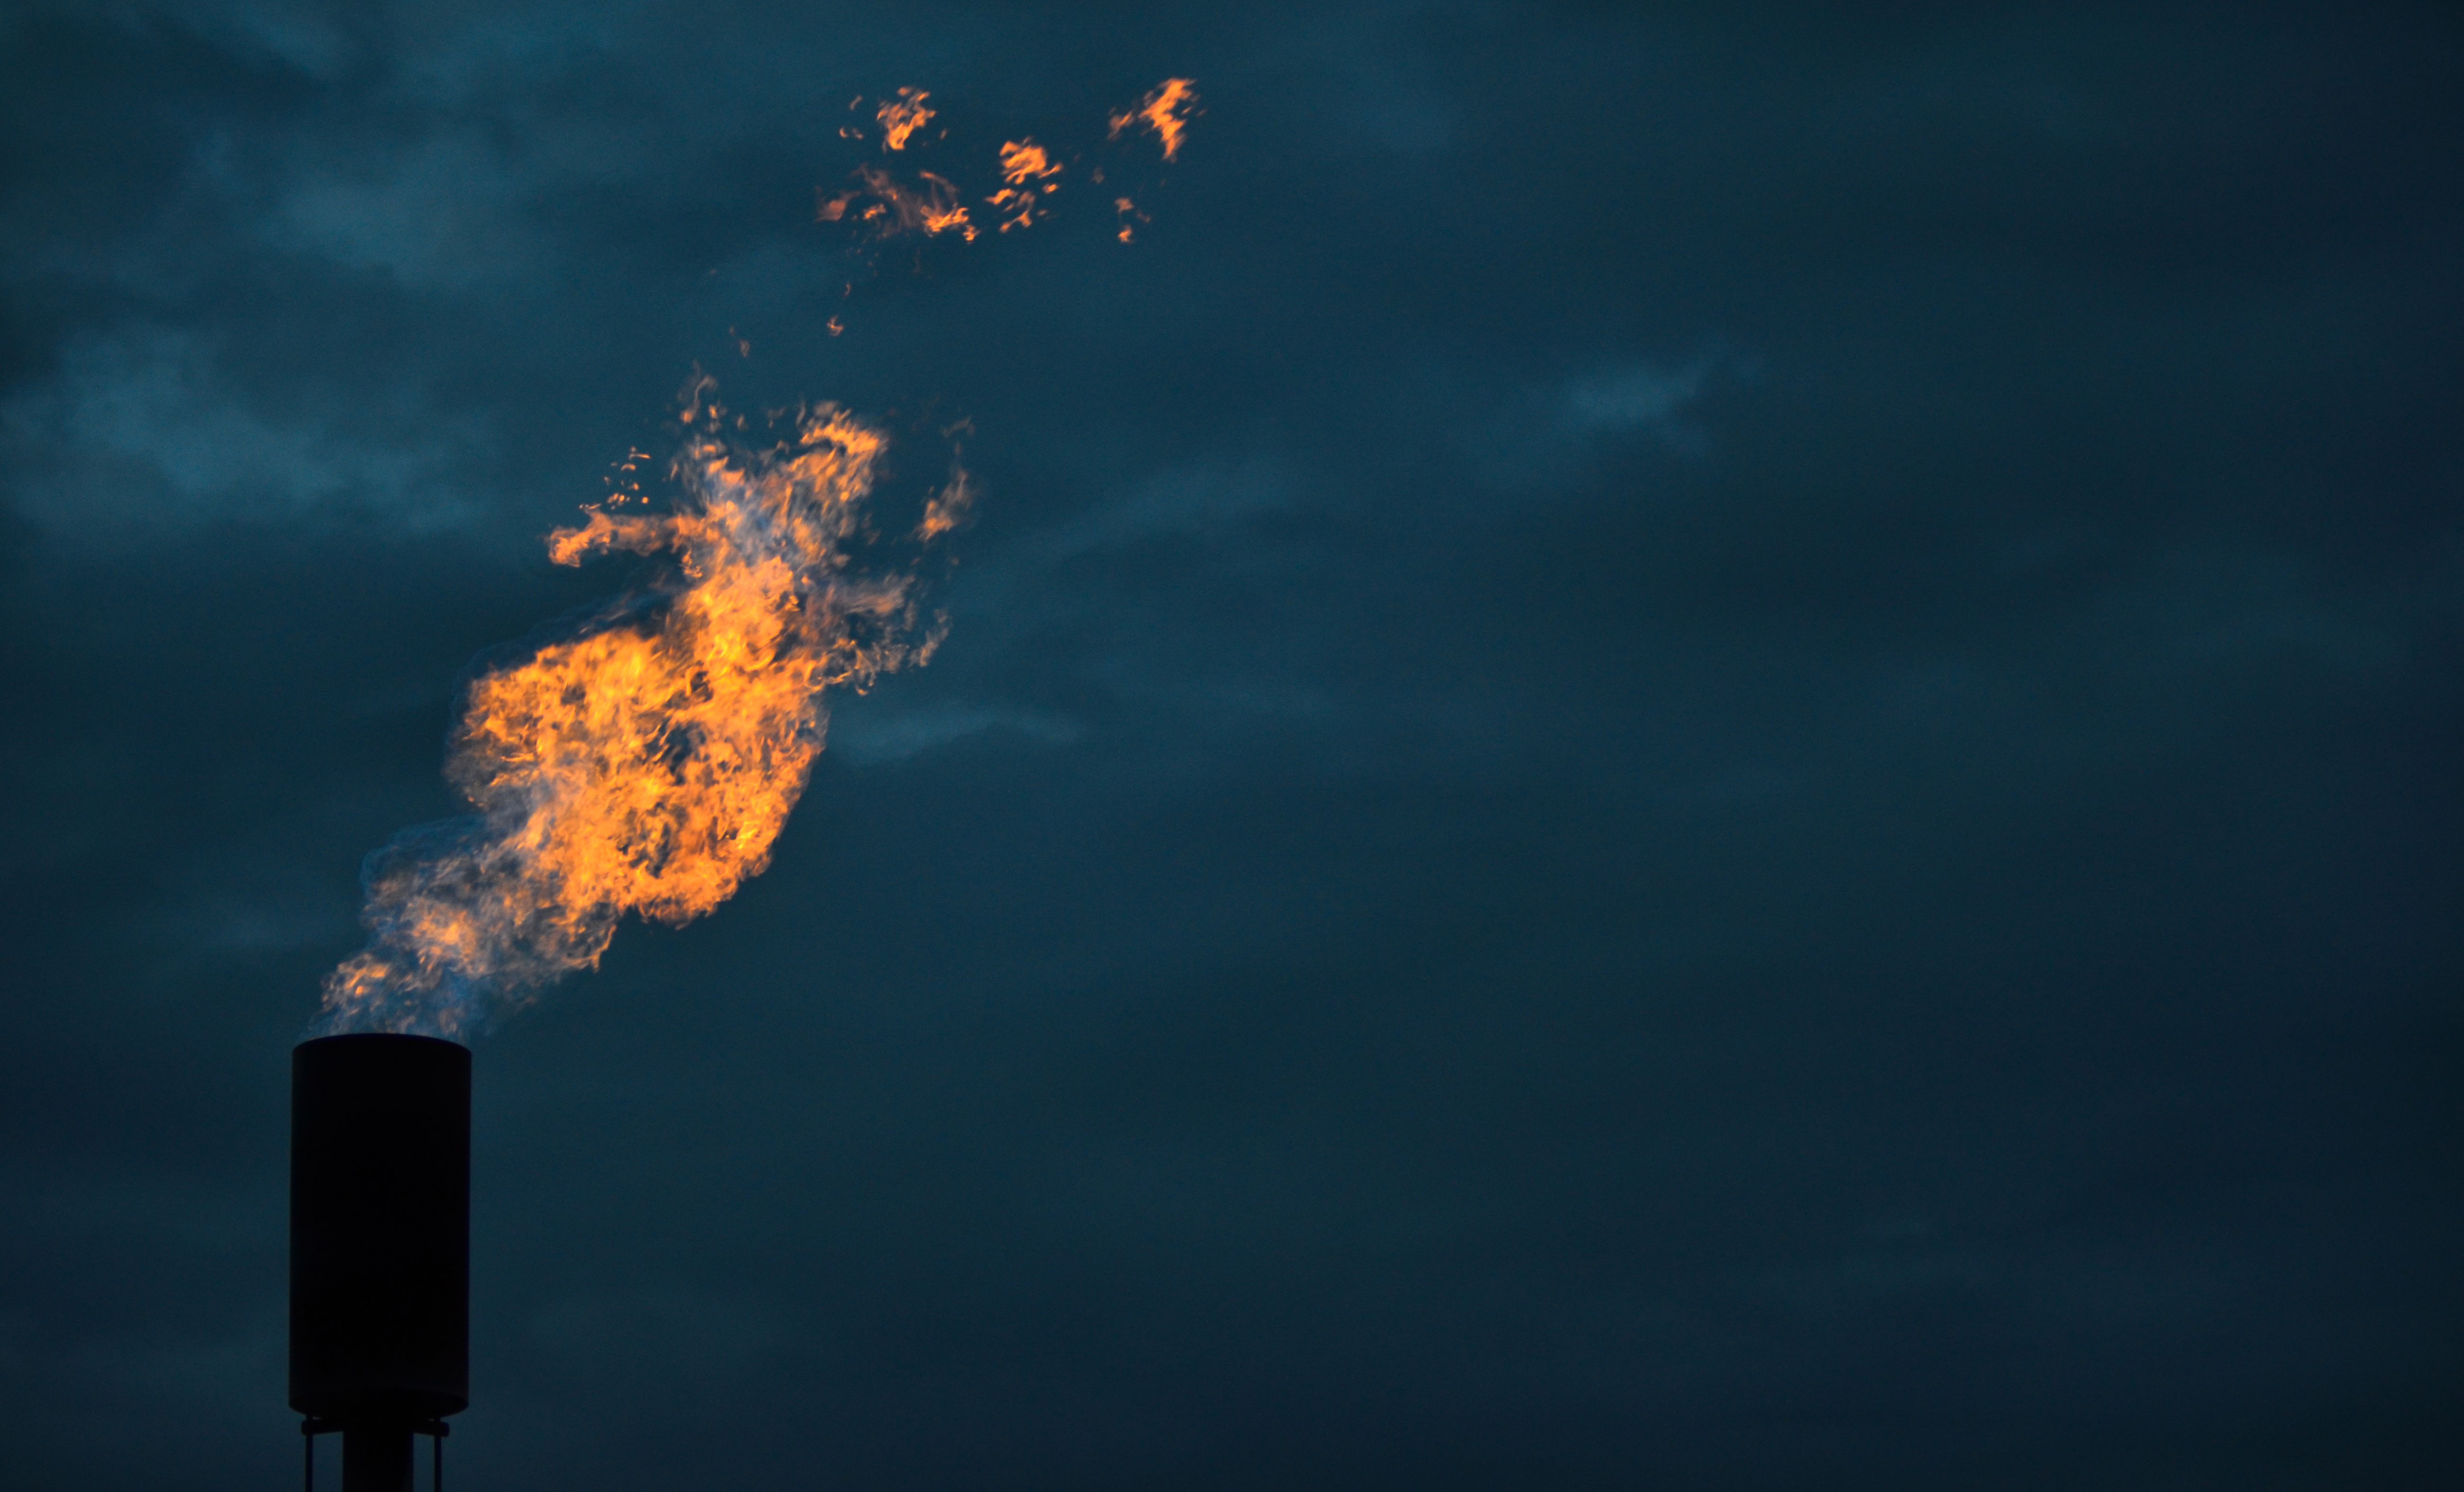
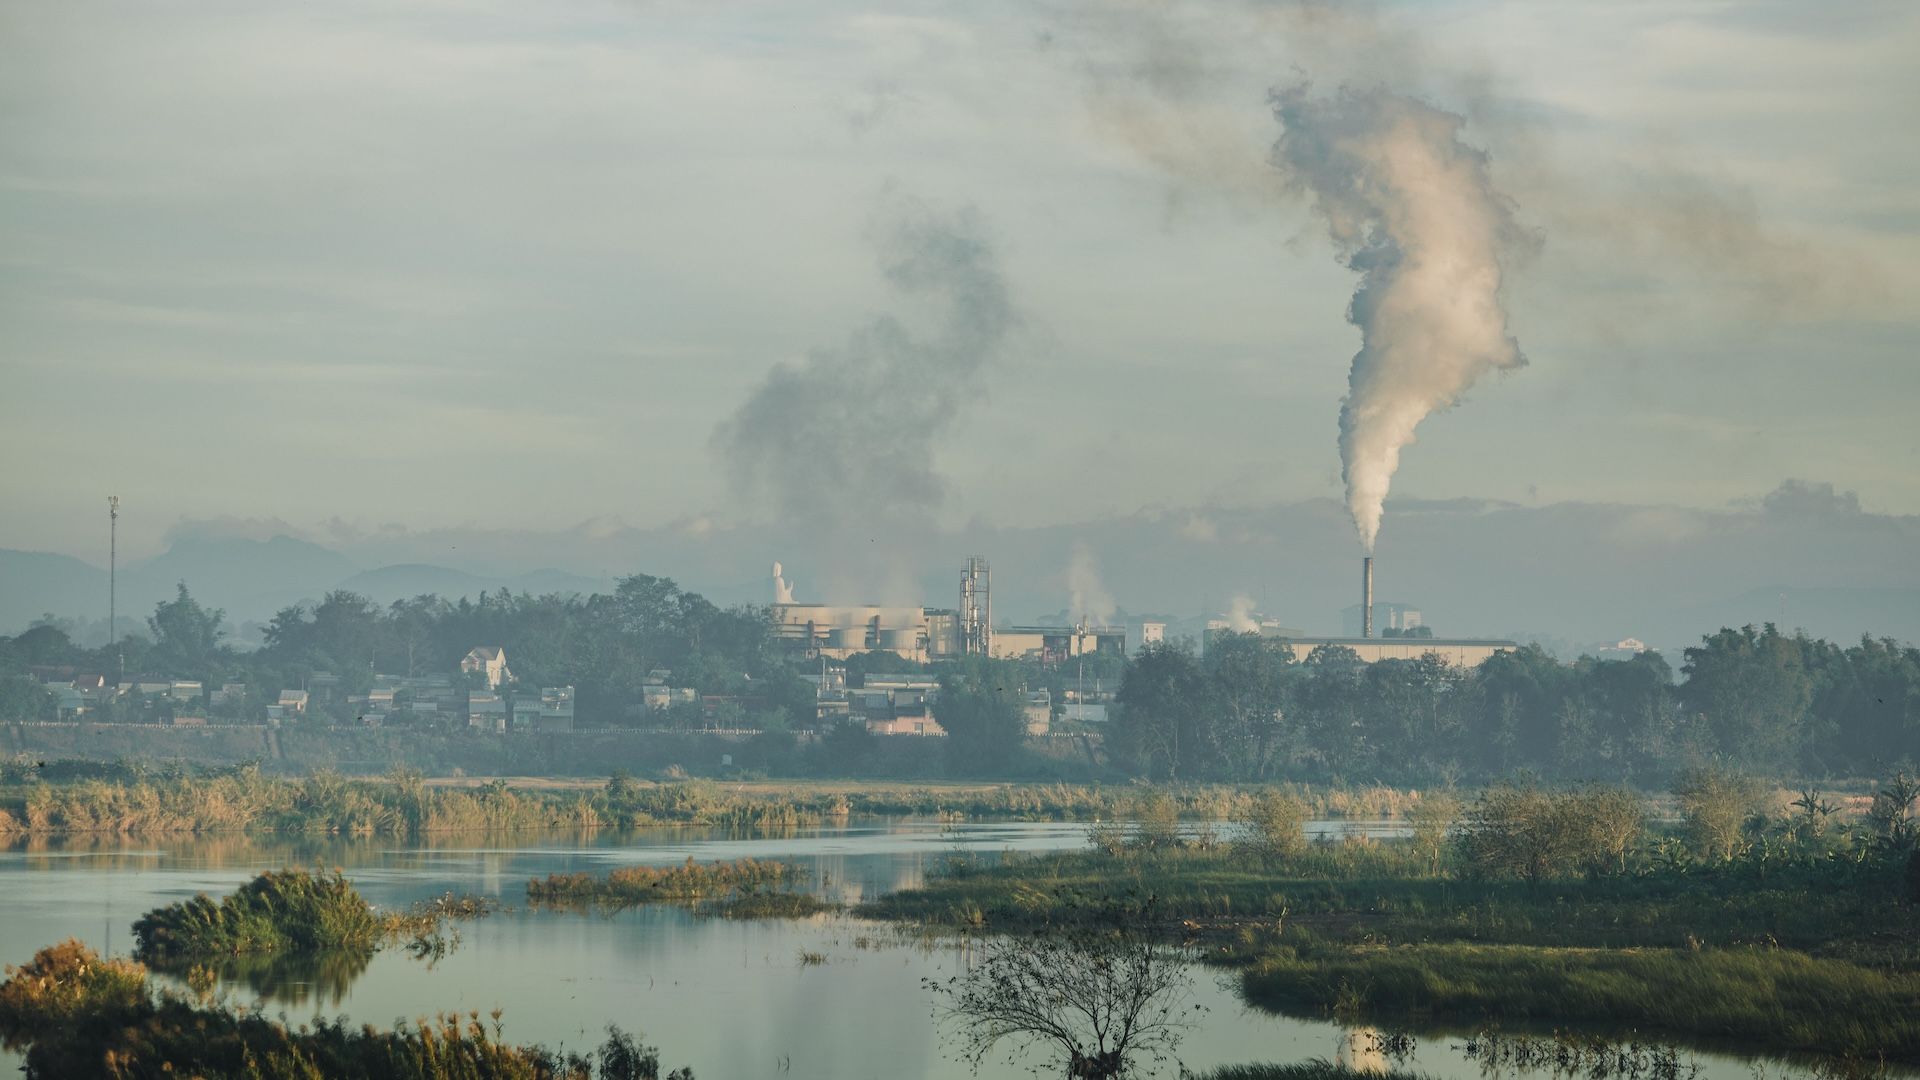
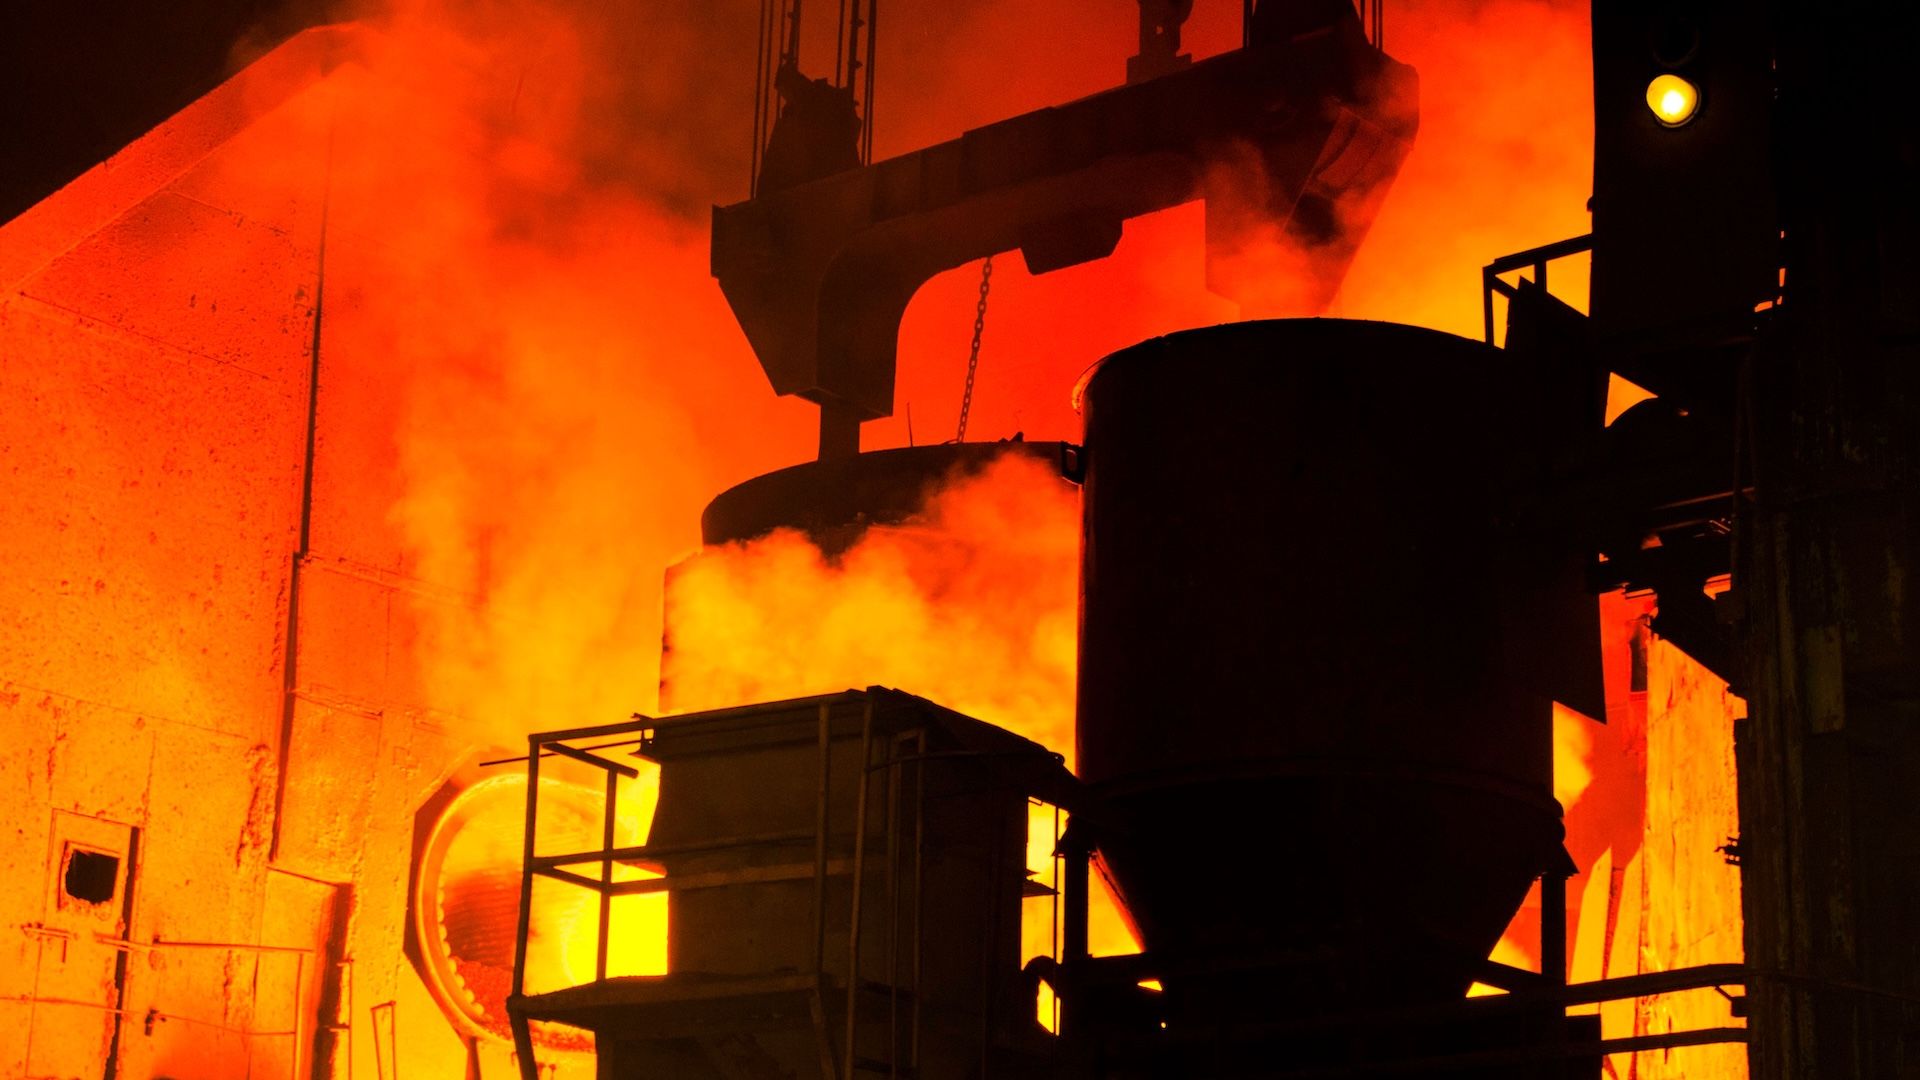
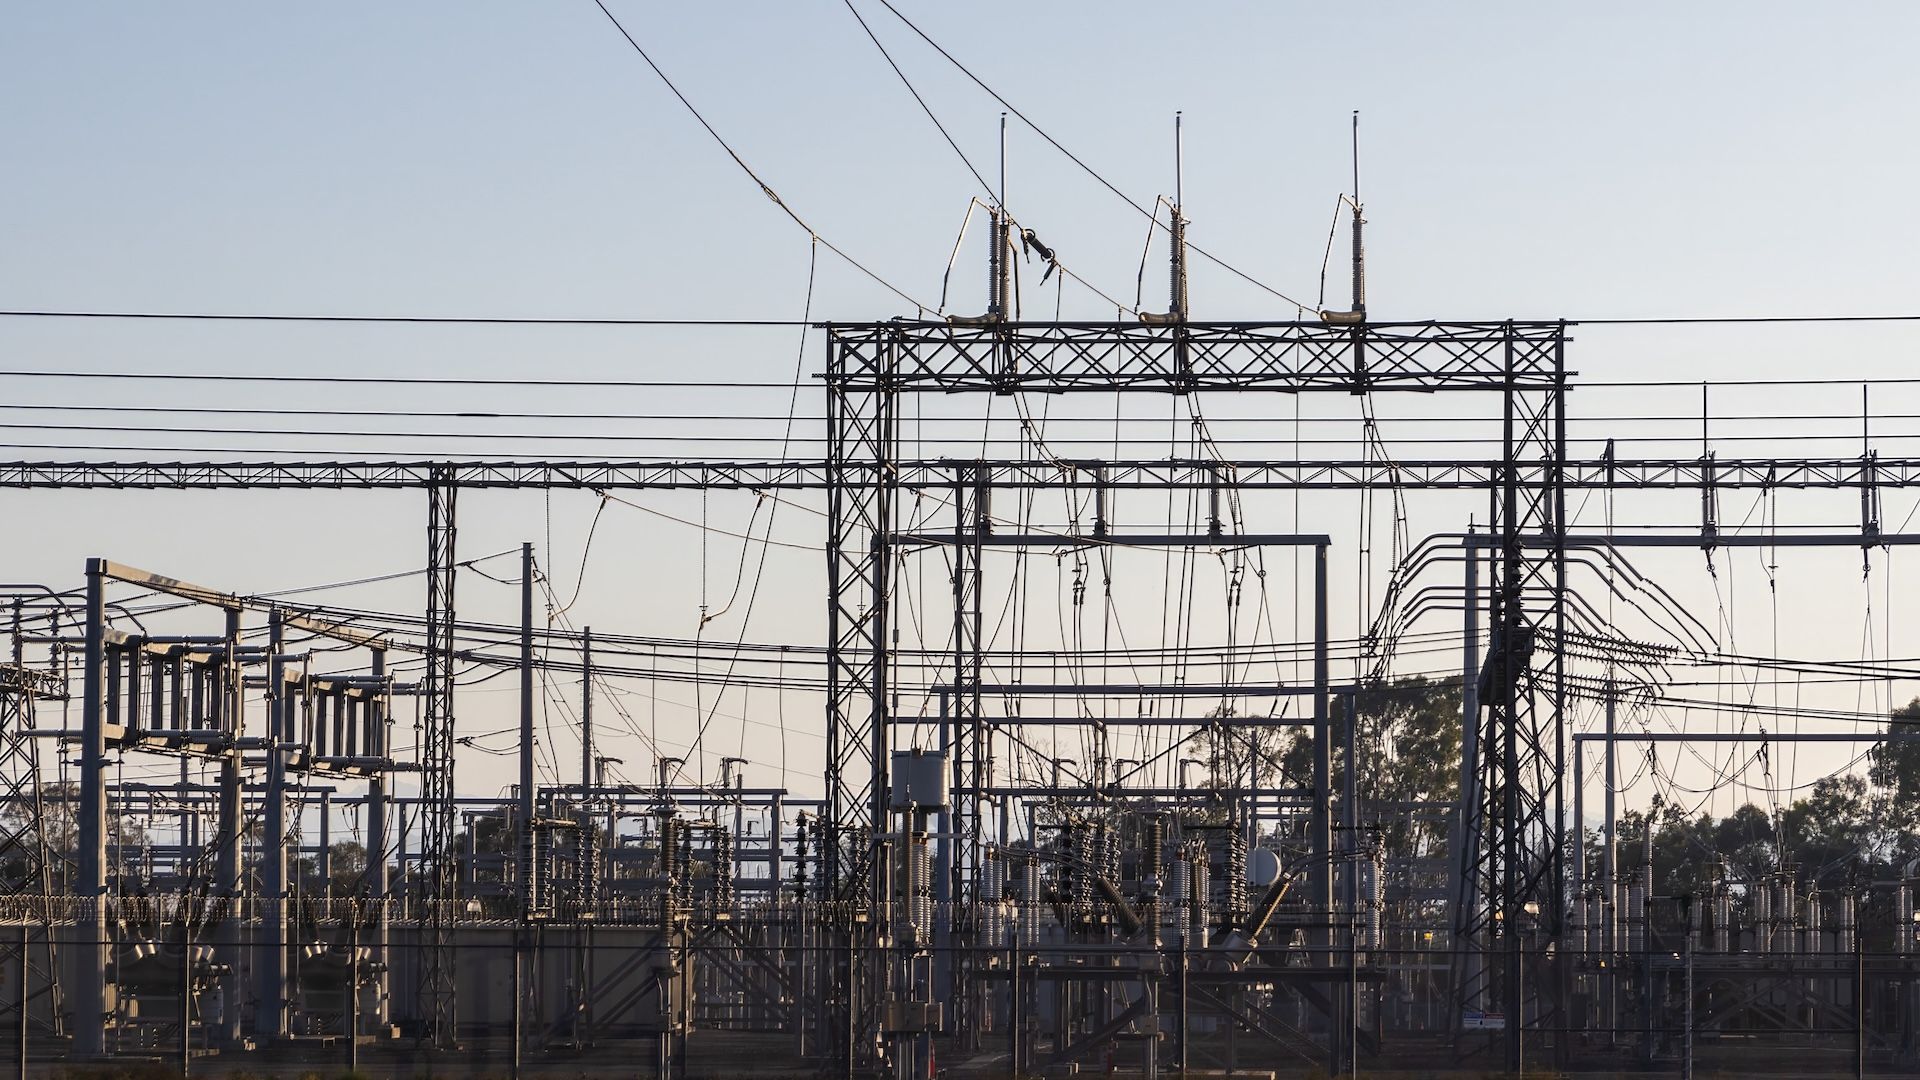
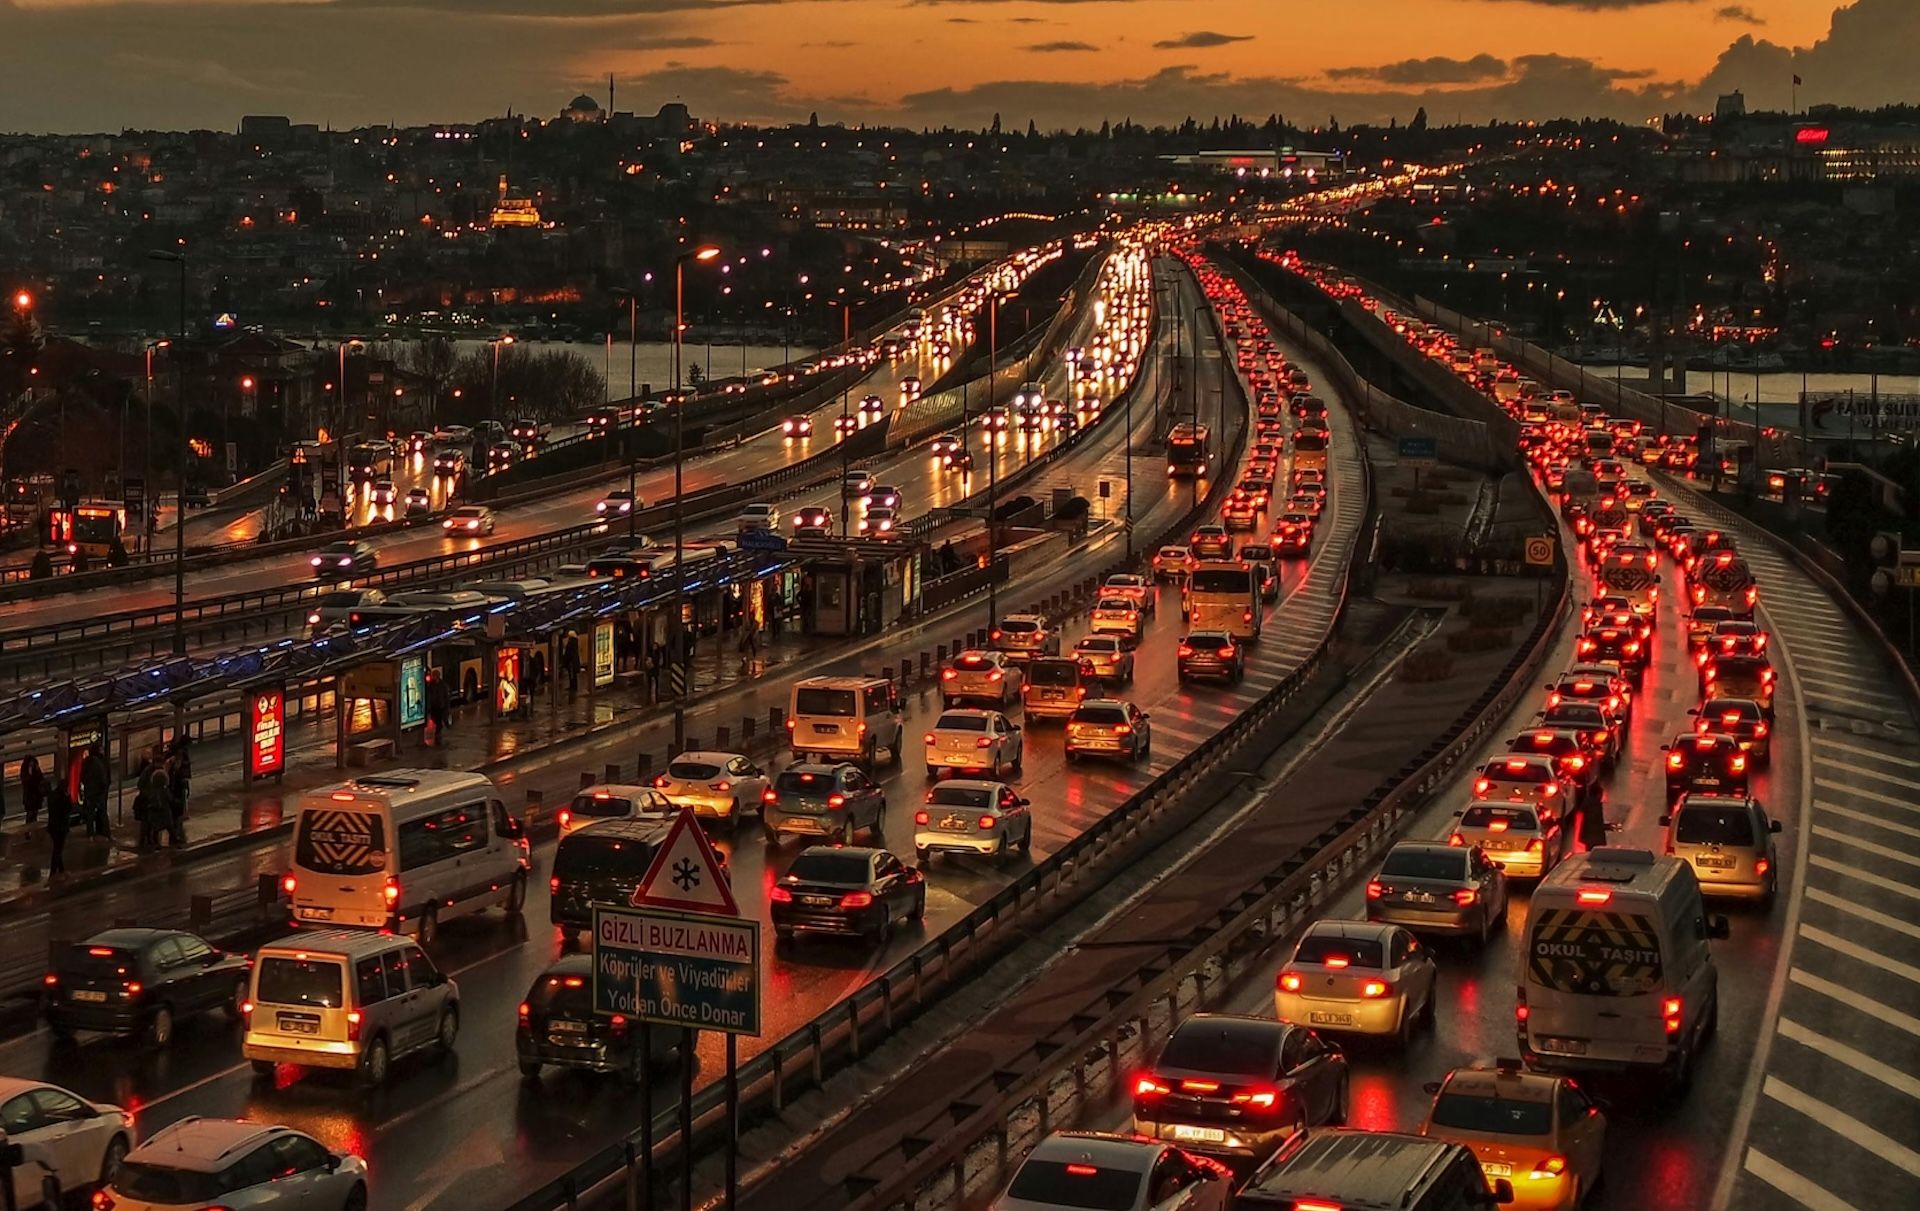
Most human economic activities release greenhouse gases into the Earth's atmosphere. We use satellites and other remote sensing technologies to spot these emissions activities.
This Climate TRACE Emissions Reduction Solution (ERS) spotlight focuses on electrifying mining equipment at the Copper Mountain Mine in British Columbia, Canada.
This article looks at how satellites and aircraft are changing the way we see climate-warming greenhouse gases. In this piece, you can preview some tools, including Climate TRACE's tool, that display different types of pollution and learn a few ways to track down the sources of pollution to reveal who’s responsible.
We recently talked with Amy Gottsegen, Software Engineer, and Randy Sargent, Visualization Director, both at Carnegie Mellon University’s CREATE Lab, whose atmospheric modeling powers Climate TRACE’s air pollution tracking and plumes animation tool.