Climate TRACE Road Transportation Emissions: Correcting the Record on City-Level Accuracy
In May 2026, researchers from Northern Arizona University published a paper claiming that Climate TRACE’s city-level analysis of road transportation emissions undercounted those emissions by an average of 70%, when compared to their own Vulcan 4.0 inventory. While we appreciate the external review of the Climate TRACE inventory, unfortunately in this instance, the analysis is based on outdated, anomalous data and as a result, the paper inaccurately represents Climate TRACE’s road transportation data.
The study relies on data that is over a year out of date:
- This study uses old, anomalous data from a 2-month period when there was a bug present in our cities dataset (but did not impact any other aggregated or asset-level road transportation data).
- Climate TRACE identified, disclosed, and promptly corrected this bug a year ago.
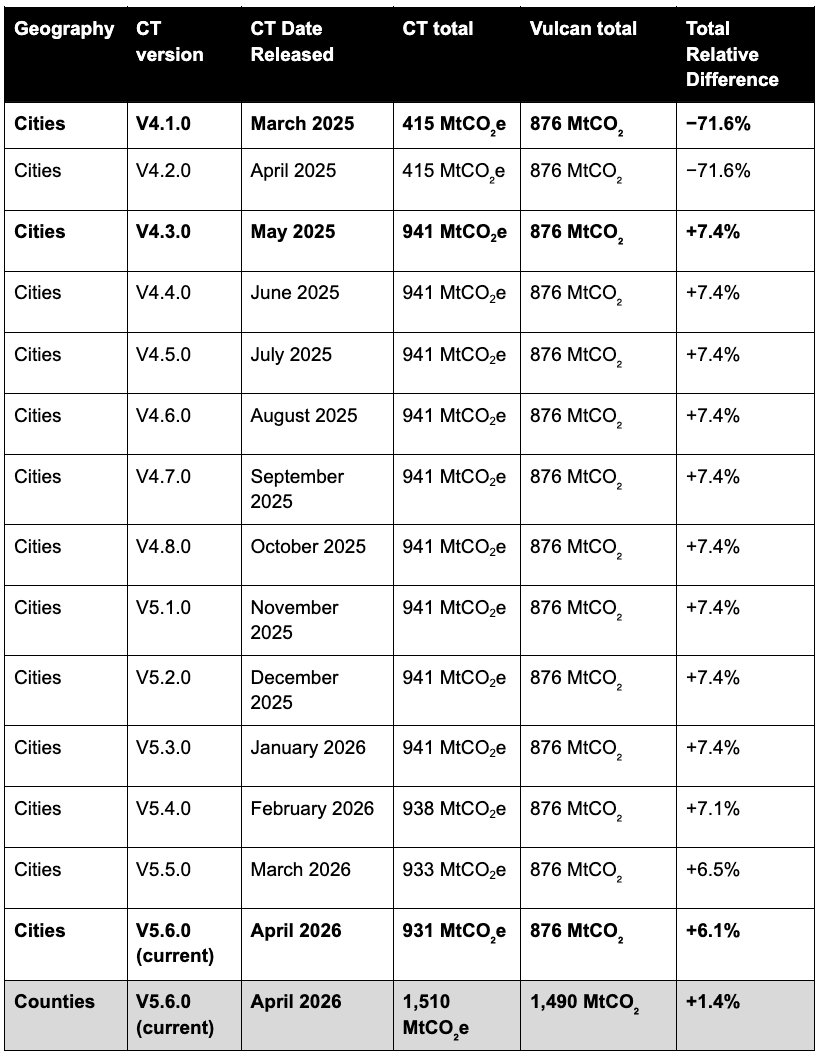
- The bug occurred in late March 2025 in Climate TRACE data version 4.1.0, the Climate TRACE team identified the bug that same month, and we published corrected data as quickly as was feasible (in May 2025).
- We clearly documented the bug fix in our public changelogs (which we publish alongside every monthly data release).
- The bug has not been present in Climate TRACE data since May 2025 — six months before the paper was submitted for publication and ten months before the final revisions were made to the paper.
In reality, Climate TRACE and Vulcan data show similar trends in city-level road transportation emissions:
- For the past year, Climate TRACE’s city road transportation emissions have averaged a 6-7% difference with Vulcan’s inventory (see chart below).
- At both the county and national levels, Climate TRACE and Vulcan’s emissions estimates are within 1.4% of each other.
- Both Climate TRACE and Vulcan report similar overall rankings of cities’ road transport emissions as well as strong alignment in trends in road emissions within cities over time.
- Differences at this scale are common to see among various emissions inventories and are likely attributable to differences in methodologies, underlying data, and geographic boundaries (for urban areas) used.
Climate TRACE continuously improves its inventory as additional data and improved methods become available:
- Climate TRACE is built on a model of continual improvement, harnessing AI to constantly analyze and ingest the most relevant information on human activities that emit greenhouse gases.
- We publish data every month to ensure that decision-makers of all kinds have access to high-quality, timely information on greenhouse gas emissions.
- Our teams are constantly reviewing their data; seeking feedback from partners and sources of ground-truth information; and comparing against other inventories in order to improve our own methods and deliver actionable information.
- We welcome engagement from researchers and any others who have suggestions for improving our inventory.
- Unfortunately, the authors of this paper did not connect with us regarding their results prior to publication. We would have been happy to discuss the anomaly and ensure their team had the subsequent versions of data to flesh out their analysis.
For further information about Climate TRACE’s road transportation emissions estimates: All Climate TRACE methodology information and changelogs are located on our Github account. Detailed historical versions of Climate TRACE data are available on BigQuery and Zenodo. We will also soon be publishing an update on our efforts to further refine our road transportation emissions inventory as part of our recently-announced collaboration with Crosswalk Labs.