Understanding and using Climate TRACE ownership data for emitting assets

Every asset --- a power plant, a steel factory, an oil refinery --- has parties that are responsible for it. But historically it's been challenging if not impossible to pinpoint the complex chain of ownership across each level, from the immediate (i.e., direct) owner all the way up to ultimate (i.e., parent) owners.
Climate TRACE and coalition member Global Energy Monitor are changing that with a powerful ownership dataset linking emitting assets to their corporate, financial, and government owners.
Now these data make it possible to identify who ultimately controls emissions-producing infrastructure worldwide, in turn supporting accountability, financial disclosure, and policy analysis by showing how emissions are distributed across owners and sectors.
Types of owners and how our full ownership hierarchy works
Each asset in the dataset can be traced through an ownership tree connecting it to higher-level companies or institutions. That ownership tree spans two important endpoints of owners:
-
Immediate owner: This is the direct owner, and sometimes operator, of the asset.
-
Ultimate owner: This is the highest-level parent entity (or entities) of the asset, often a holding company, investment firm, or government body.
Ownership trees can have multiple intermediate levels, where an immediate owner has more than one direct parent owner, who in turn themselves could have more than one direct parent owner, and so on.
Climate TRACE presents these relationships as full ownership trees, mapping each level of this chain from the lowest-level entity to the top-level parent. Each ownership link records the percentage owned, including both controlling and minority stakes (as long as they exceed a 5% threshold).
Ownership trees allow users to see whether an asset is directly held by a company or indirectly controlled through several intermediaries.
Ownership data coverage by sector and subsector
Climate TRACE currently includes ownership information for 18 emissions-intensive subsectors. Together, this represents full ownership data for assets responsible for 32% of global emissions, plus immediate owner data for another 14% of global emissions.
In the interactive donut chart below, sectors marked as having "full ownership" data include complete ownership trees comprising immediate, intermediate, and ultimate owners. Sectors labeled "immediate owners only" include just the direct owner, with higher-level ownership links to be completed in the future. (For instance, an oil refinery identified in the "immediate owners only" group may currently be linked to its operating company, but not yet to the larger conglomerate or state-owned enterprise behind it.)
These data are organized:
With parent entity data (ultimate owners):
-
~14,000 unique owners
-
~26,000 assets covered
With immediate owner data (direct owners):
-
~13,800 unique owners
-
~26,000 assets covered
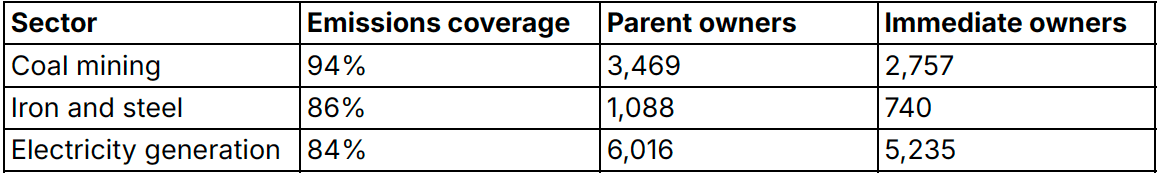
Sectors with high coverage (≥80% of sectoral emissions) include:
Simple and complex ownership examples
Ownership structures can range from straightforward to highly layered. In the case of the Amata (Rayong) power station, ownership is simple --- one or two links connecting the asset to its parent company.
By contrast, the AG der Dillinger Hüttenwerke steel plant has a complex ownership network spanning several corporate layers and cross-border investors.
How to access and use these data
Researchers and analysts can access Climate TRACE ownership data in two main ways:
-
CSV downloads: Available via the Climate TRACE data downloads page as part of the downloadable sector-level emissions files. These files provide a top-down summary linking large parent companies to the assets they control, suitable for quick exploration or initial portfolio analysis. This is done via shortest, but not all, paths.
-
Network format (nodes and edges): Available by contacting us directly. This format allows users to explore full ownership networks, conduct emissions attribution, analyze cross-border holdings, or identify major emitters across corporate structures.
For deeper ownership or network analytics, the nodes-and-edges dataset offers the most flexible way to model relationships and attributes programmatically. Researchers seeking to better understand how to use the network format are welcome to start by using this Google Colab notebook example or the Climate TRACE ownership tools github repo.
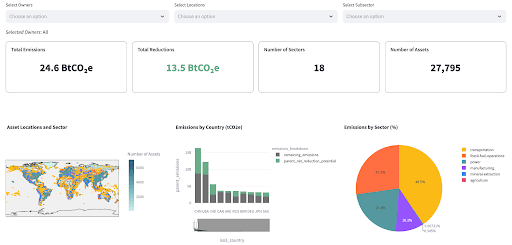
In addition, Climate TRACE has created an ownership dashboard tool to explore and visualize emissions across owners, countries, and sectors. Note: To learn about accessing this tool, please reach out to Bene de Gelder with your information and intended use case.
As Climate TRACE continues to expand full ownership coverage, this dataset will offer an increasingly comprehensive picture of corporate and government responsibility for global emissions --- a vital foundation for climate accountability and action.
Climate TRACE's ownership dataset is powered by coalition member Global Energy Monitor's Global Energy Ownership Tracker. Global Energy Monitor's Head of Ownership, Anna Mowat, is Climate TRACE's ownership lead.