Climate TRACE Releases May 2025 Emissions Data
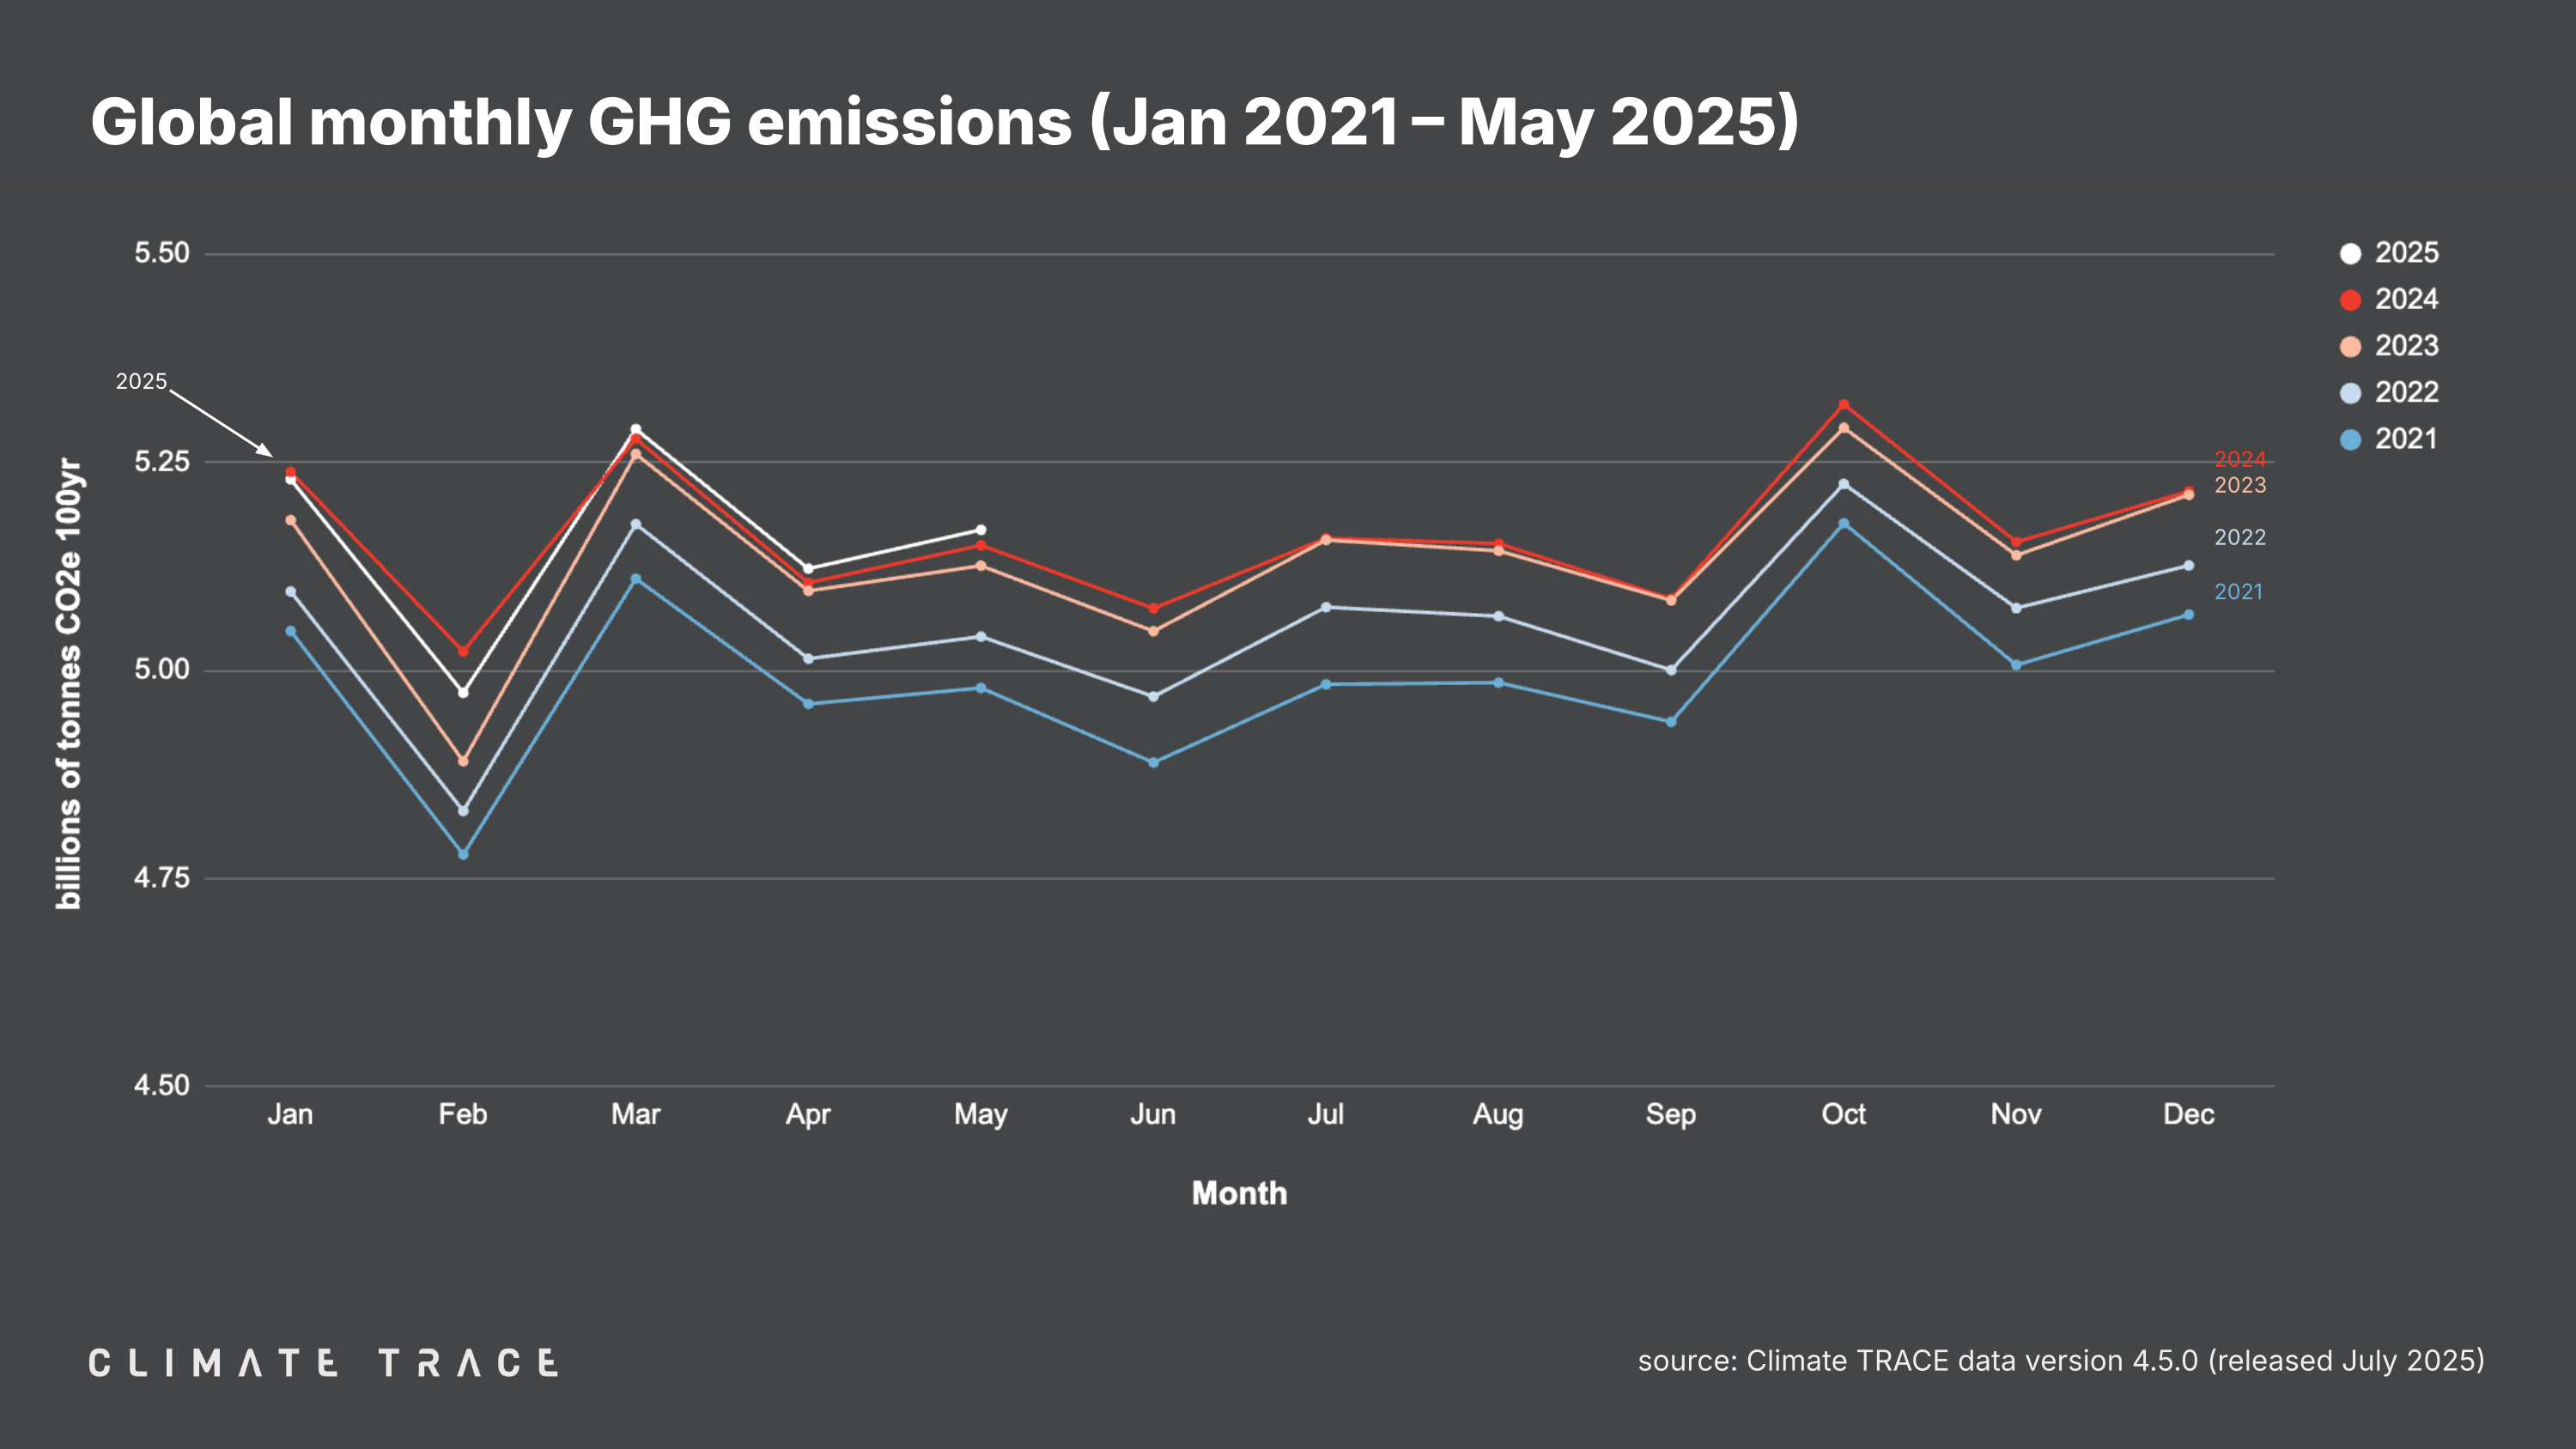
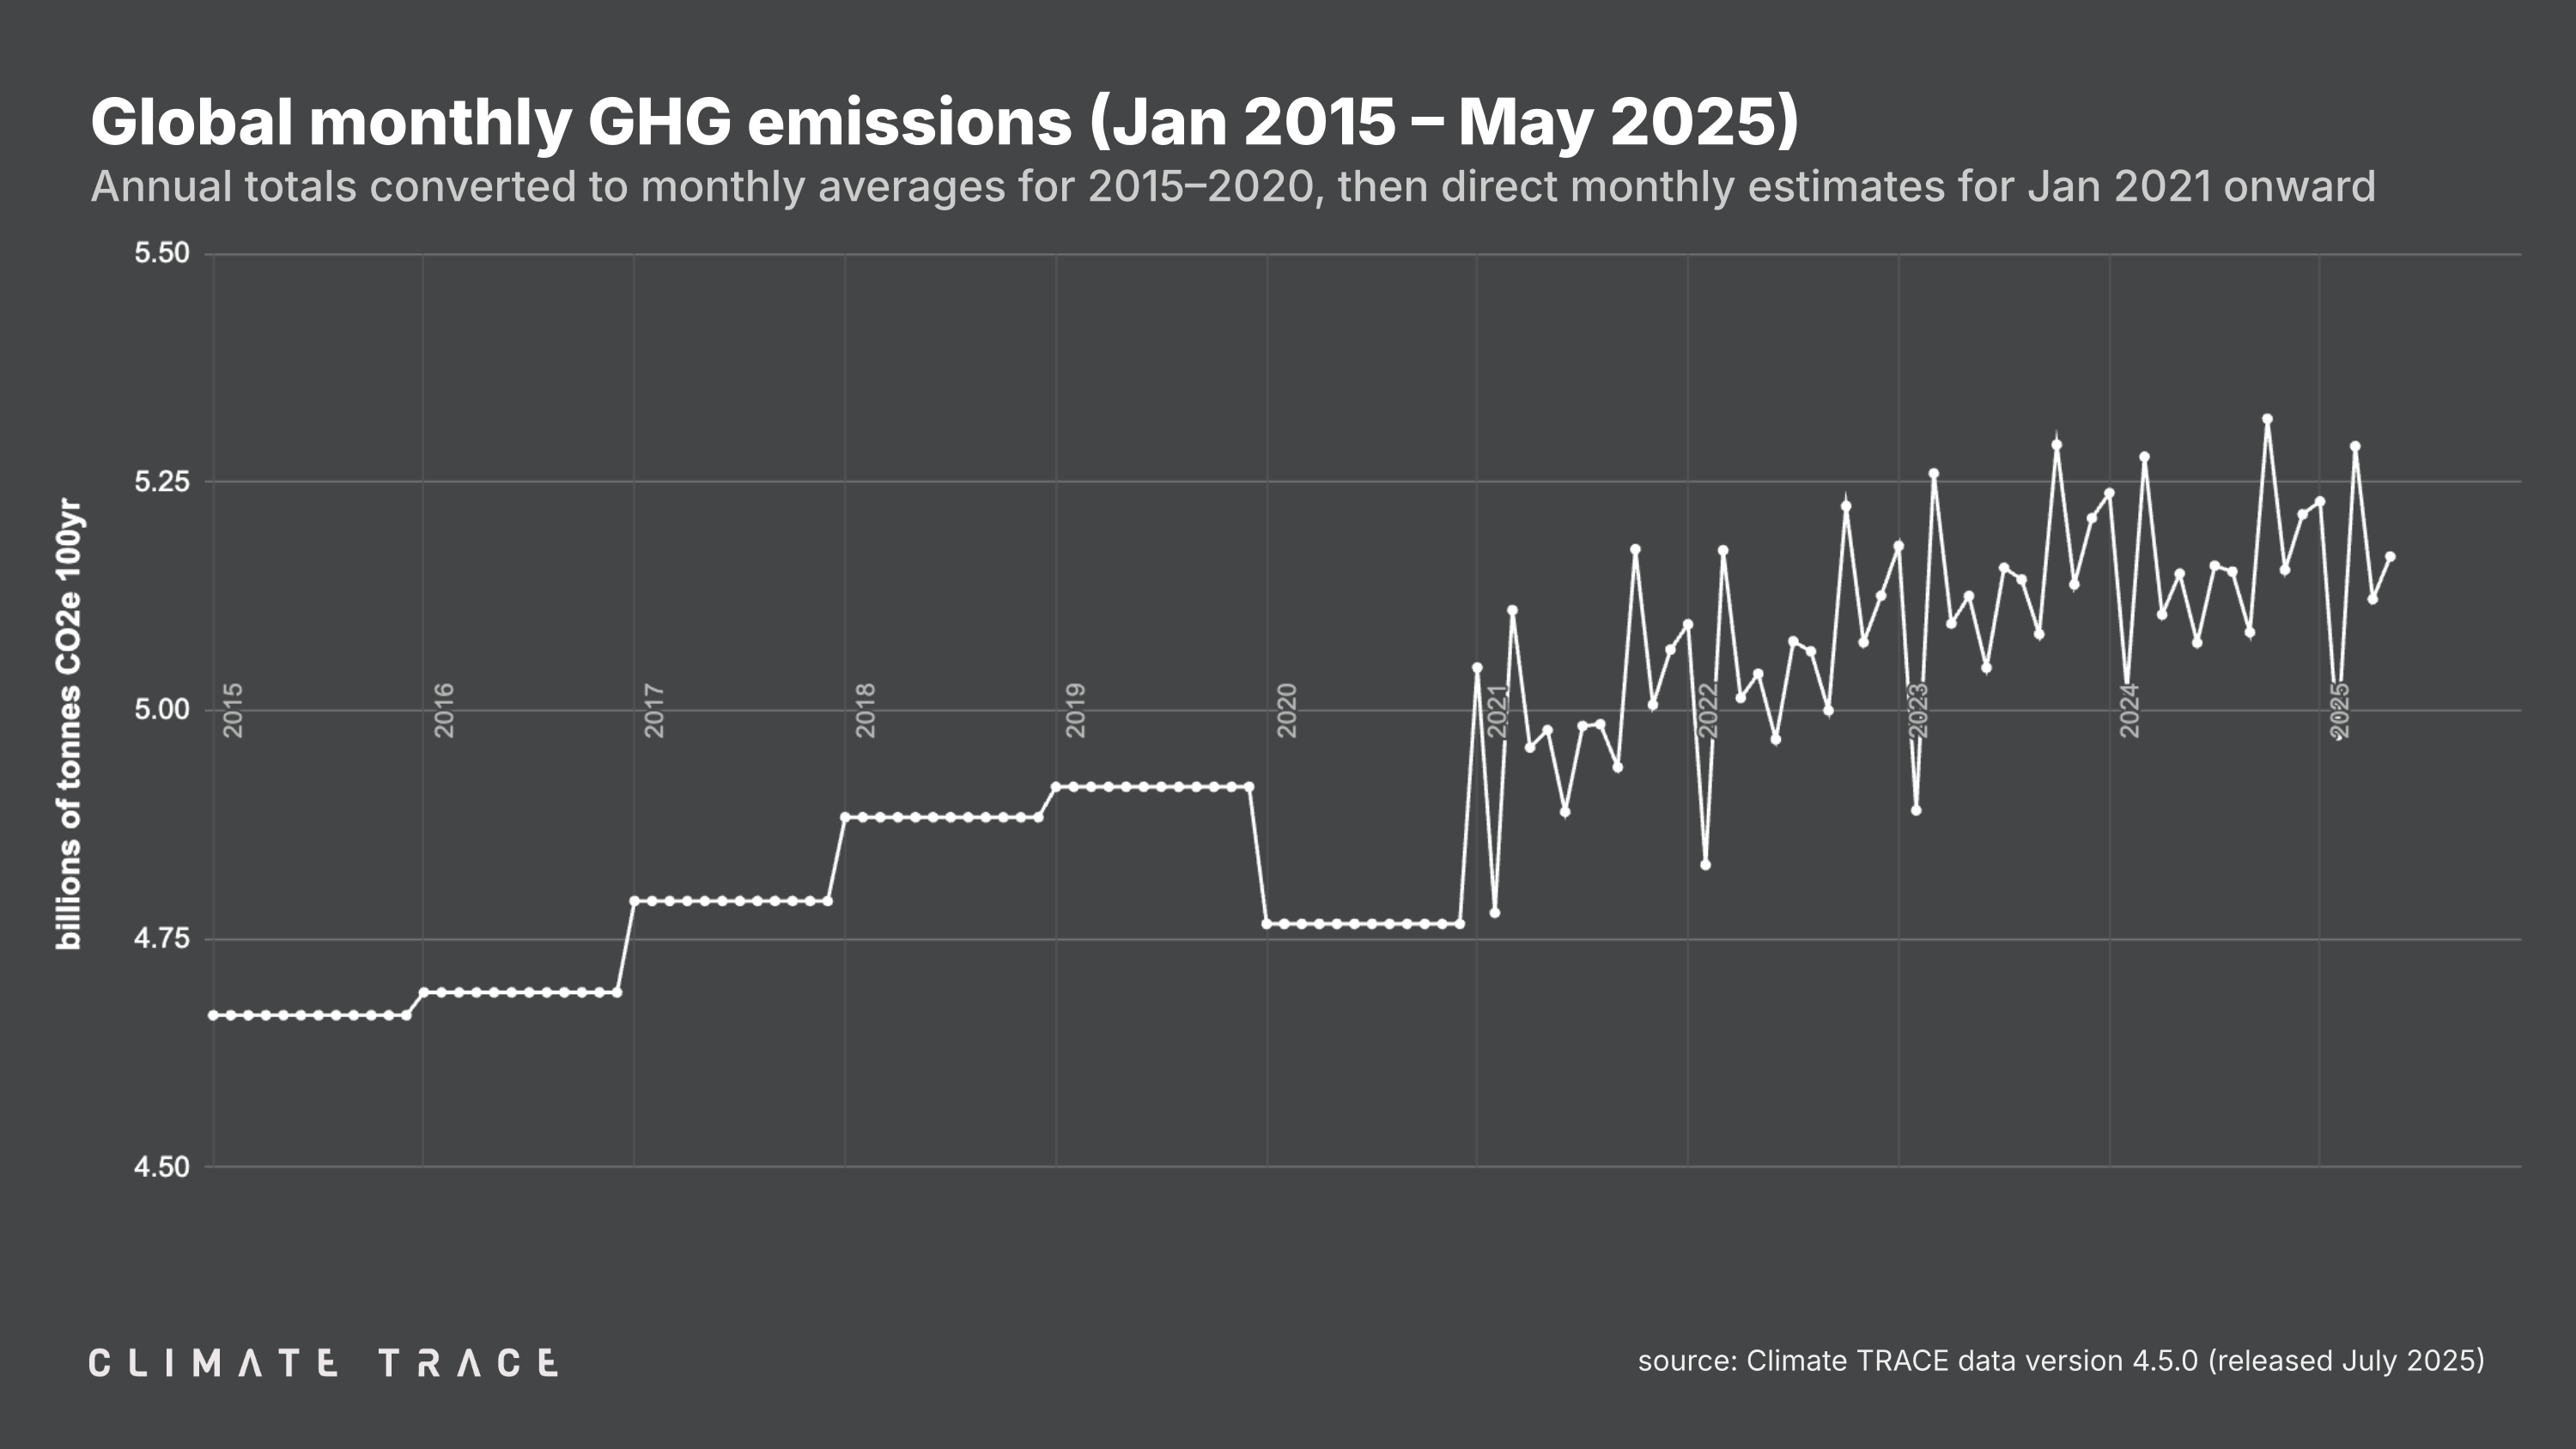
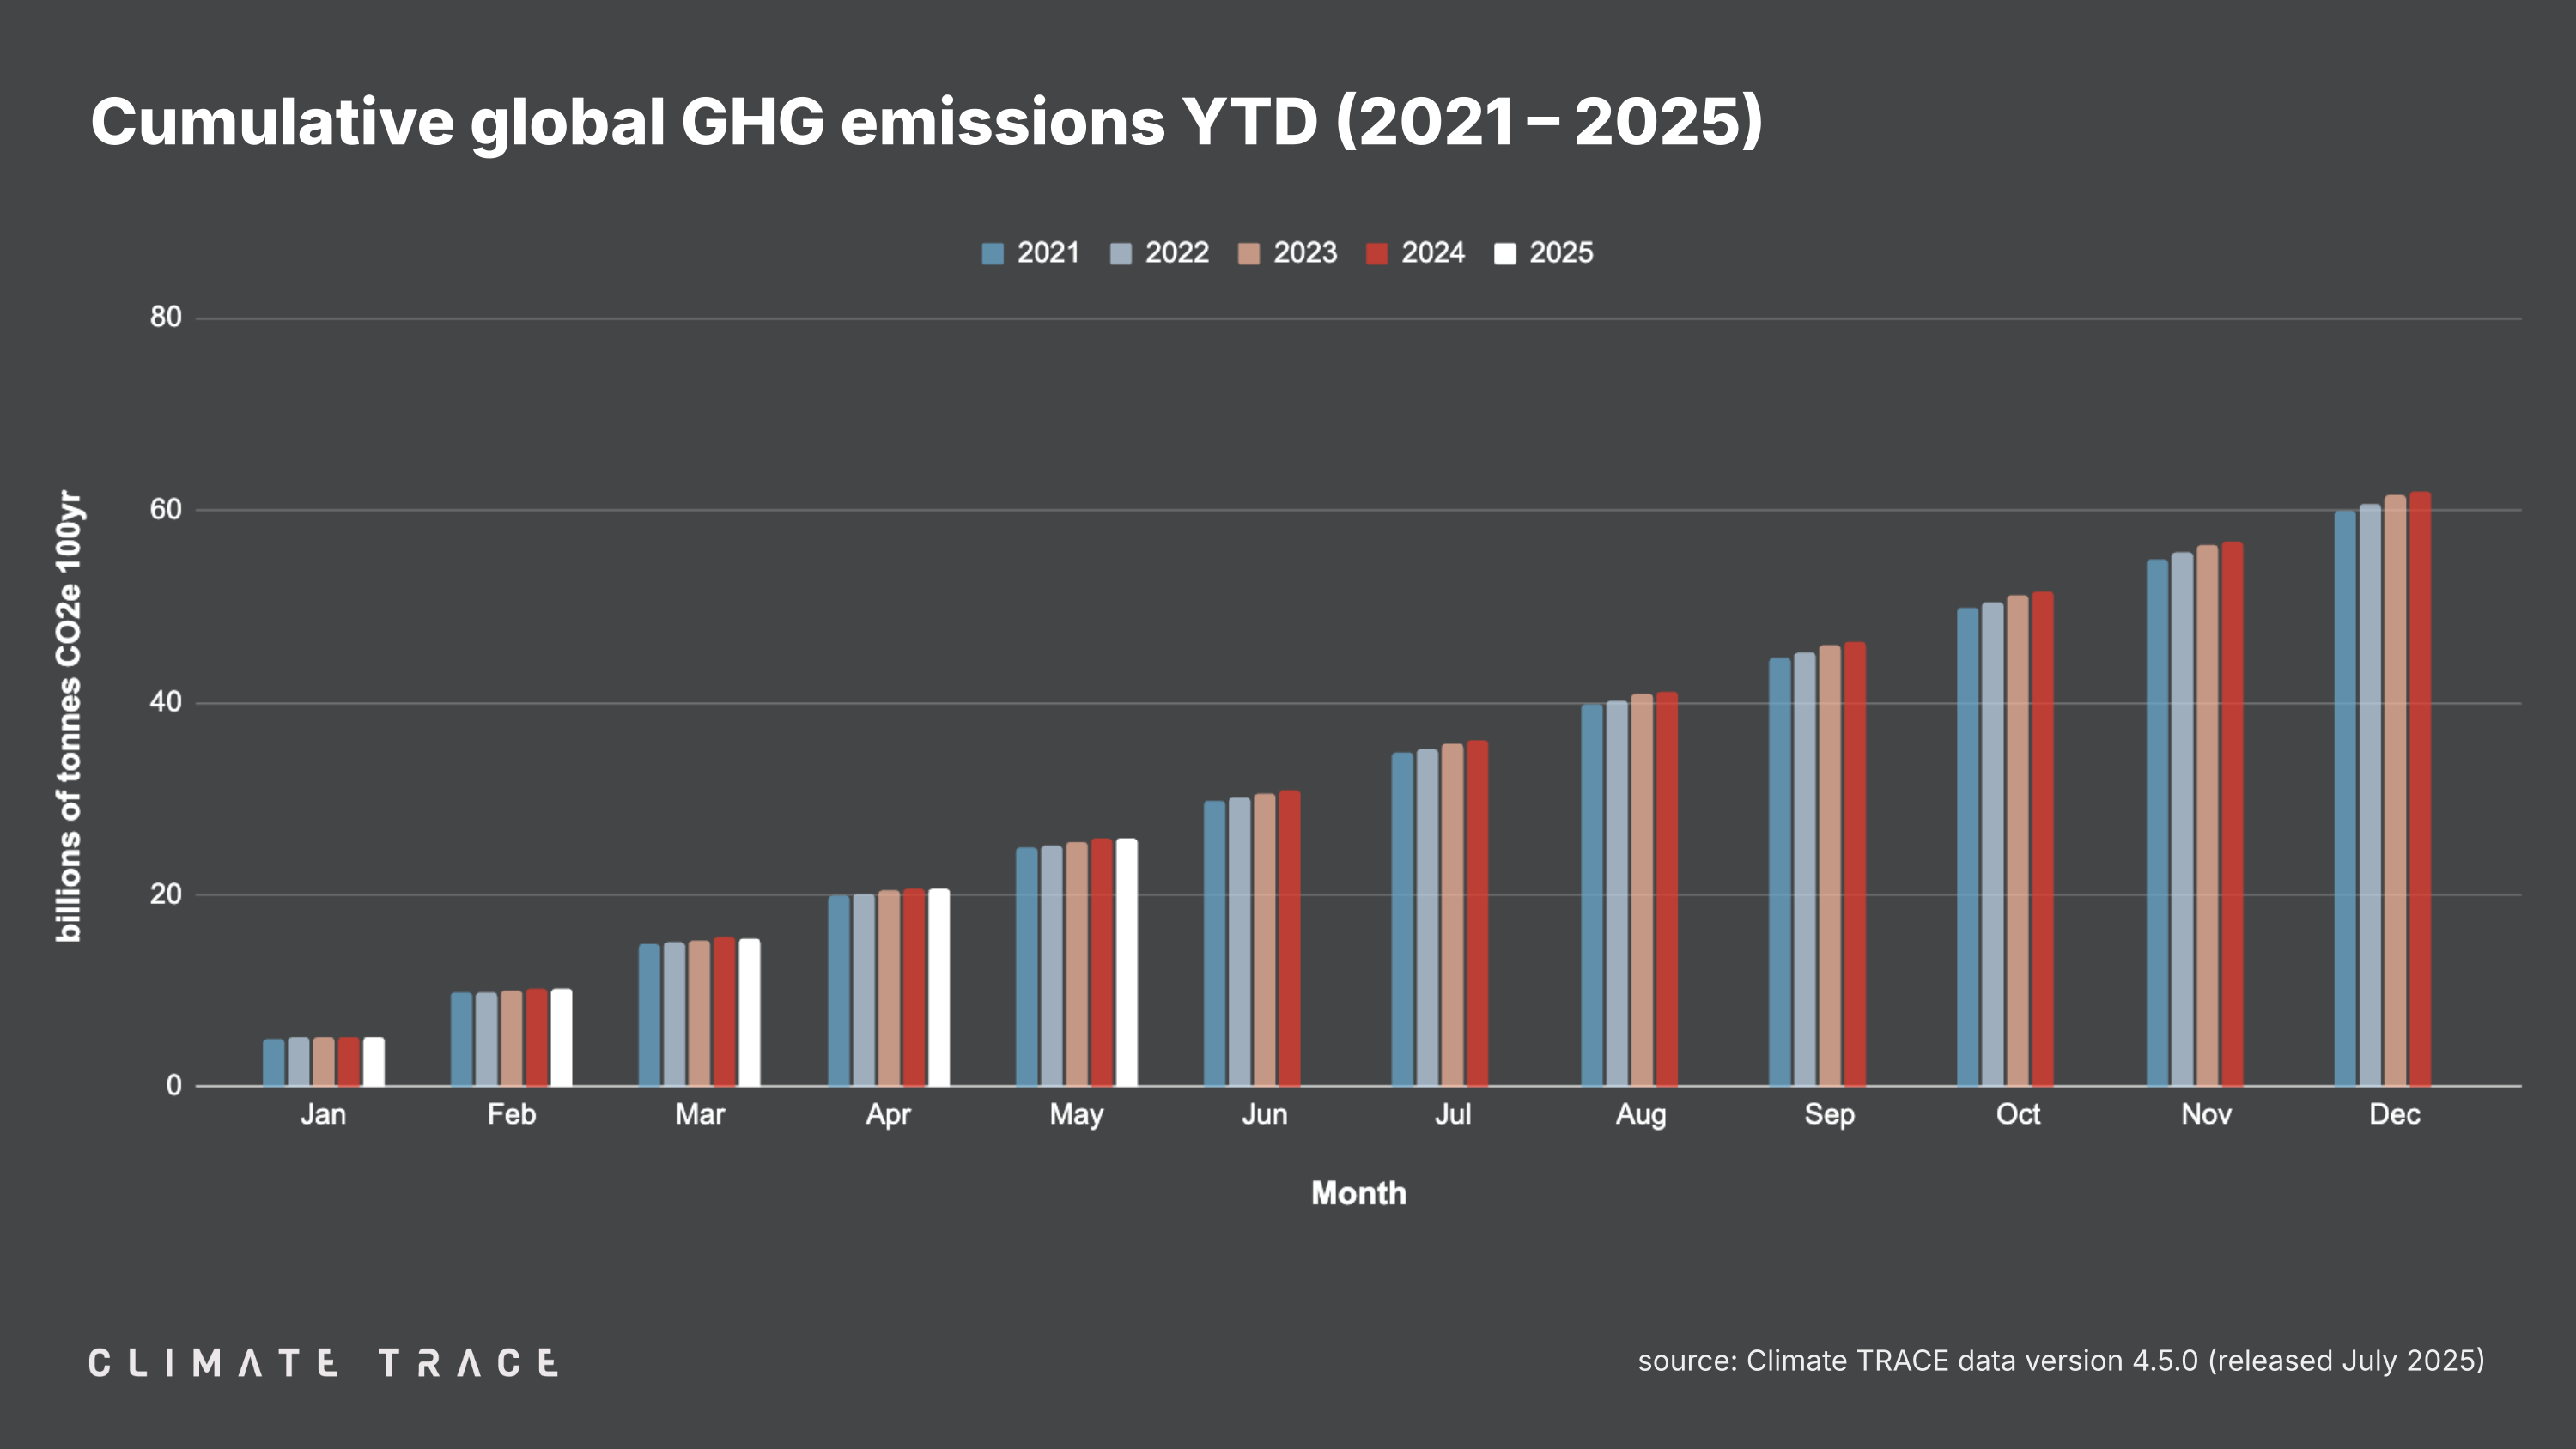
July 31, 2025 – Today, Climate TRACE reported that global greenhouse gas emissions for the month of May 2025 totaled 5.17 billion tonnes CO2e. This represents an increase of 0.36% vs. May 2024. Total global year-to-date emissions are 25.78 billion tonnes CO2e. This is 0.04% lower than the previous year-to-date total. Global methane emissions in May 2025 were 33.99 million tonnes CH4, an increase of 0.63% vs. May 2024.
Data tables summarizing emissions totals for May 2025 by sector, country, and top 100 urban areas are available for download here.
Greenhouse Gas Emissions by Country: May 2025
Climate TRACE’s preliminary estimate of May 2025 emissions in China, the world’s top emitting country, is 1.47 billion tonnes CO2e — a decrease of 1.18 million tonnes CO2e or 0.08% vs. May 2024.
Of the other top five emitting countries:
— United States emissions increased by 2.68 million tonnes CO2e, or 0.48% year over year;
— India emissions increased by 0.23 million tonnes CO2e, or 0.06% year over year;
— Russia emissions increased by 0.94 million tonnes CO2e, or 0.37% year over year;
— Indonesia emissions increased by 0.16 million tonnes CO2e, or 0.11% year over year.
In the EU, which as a bloc would be the fourth largest source of emissions in May 2025, emissions increased by 1.24 million tonnes CO2e compared to May 2024, or 0.39%.
Greenhouse Gas Emissions by Sector: May 2025
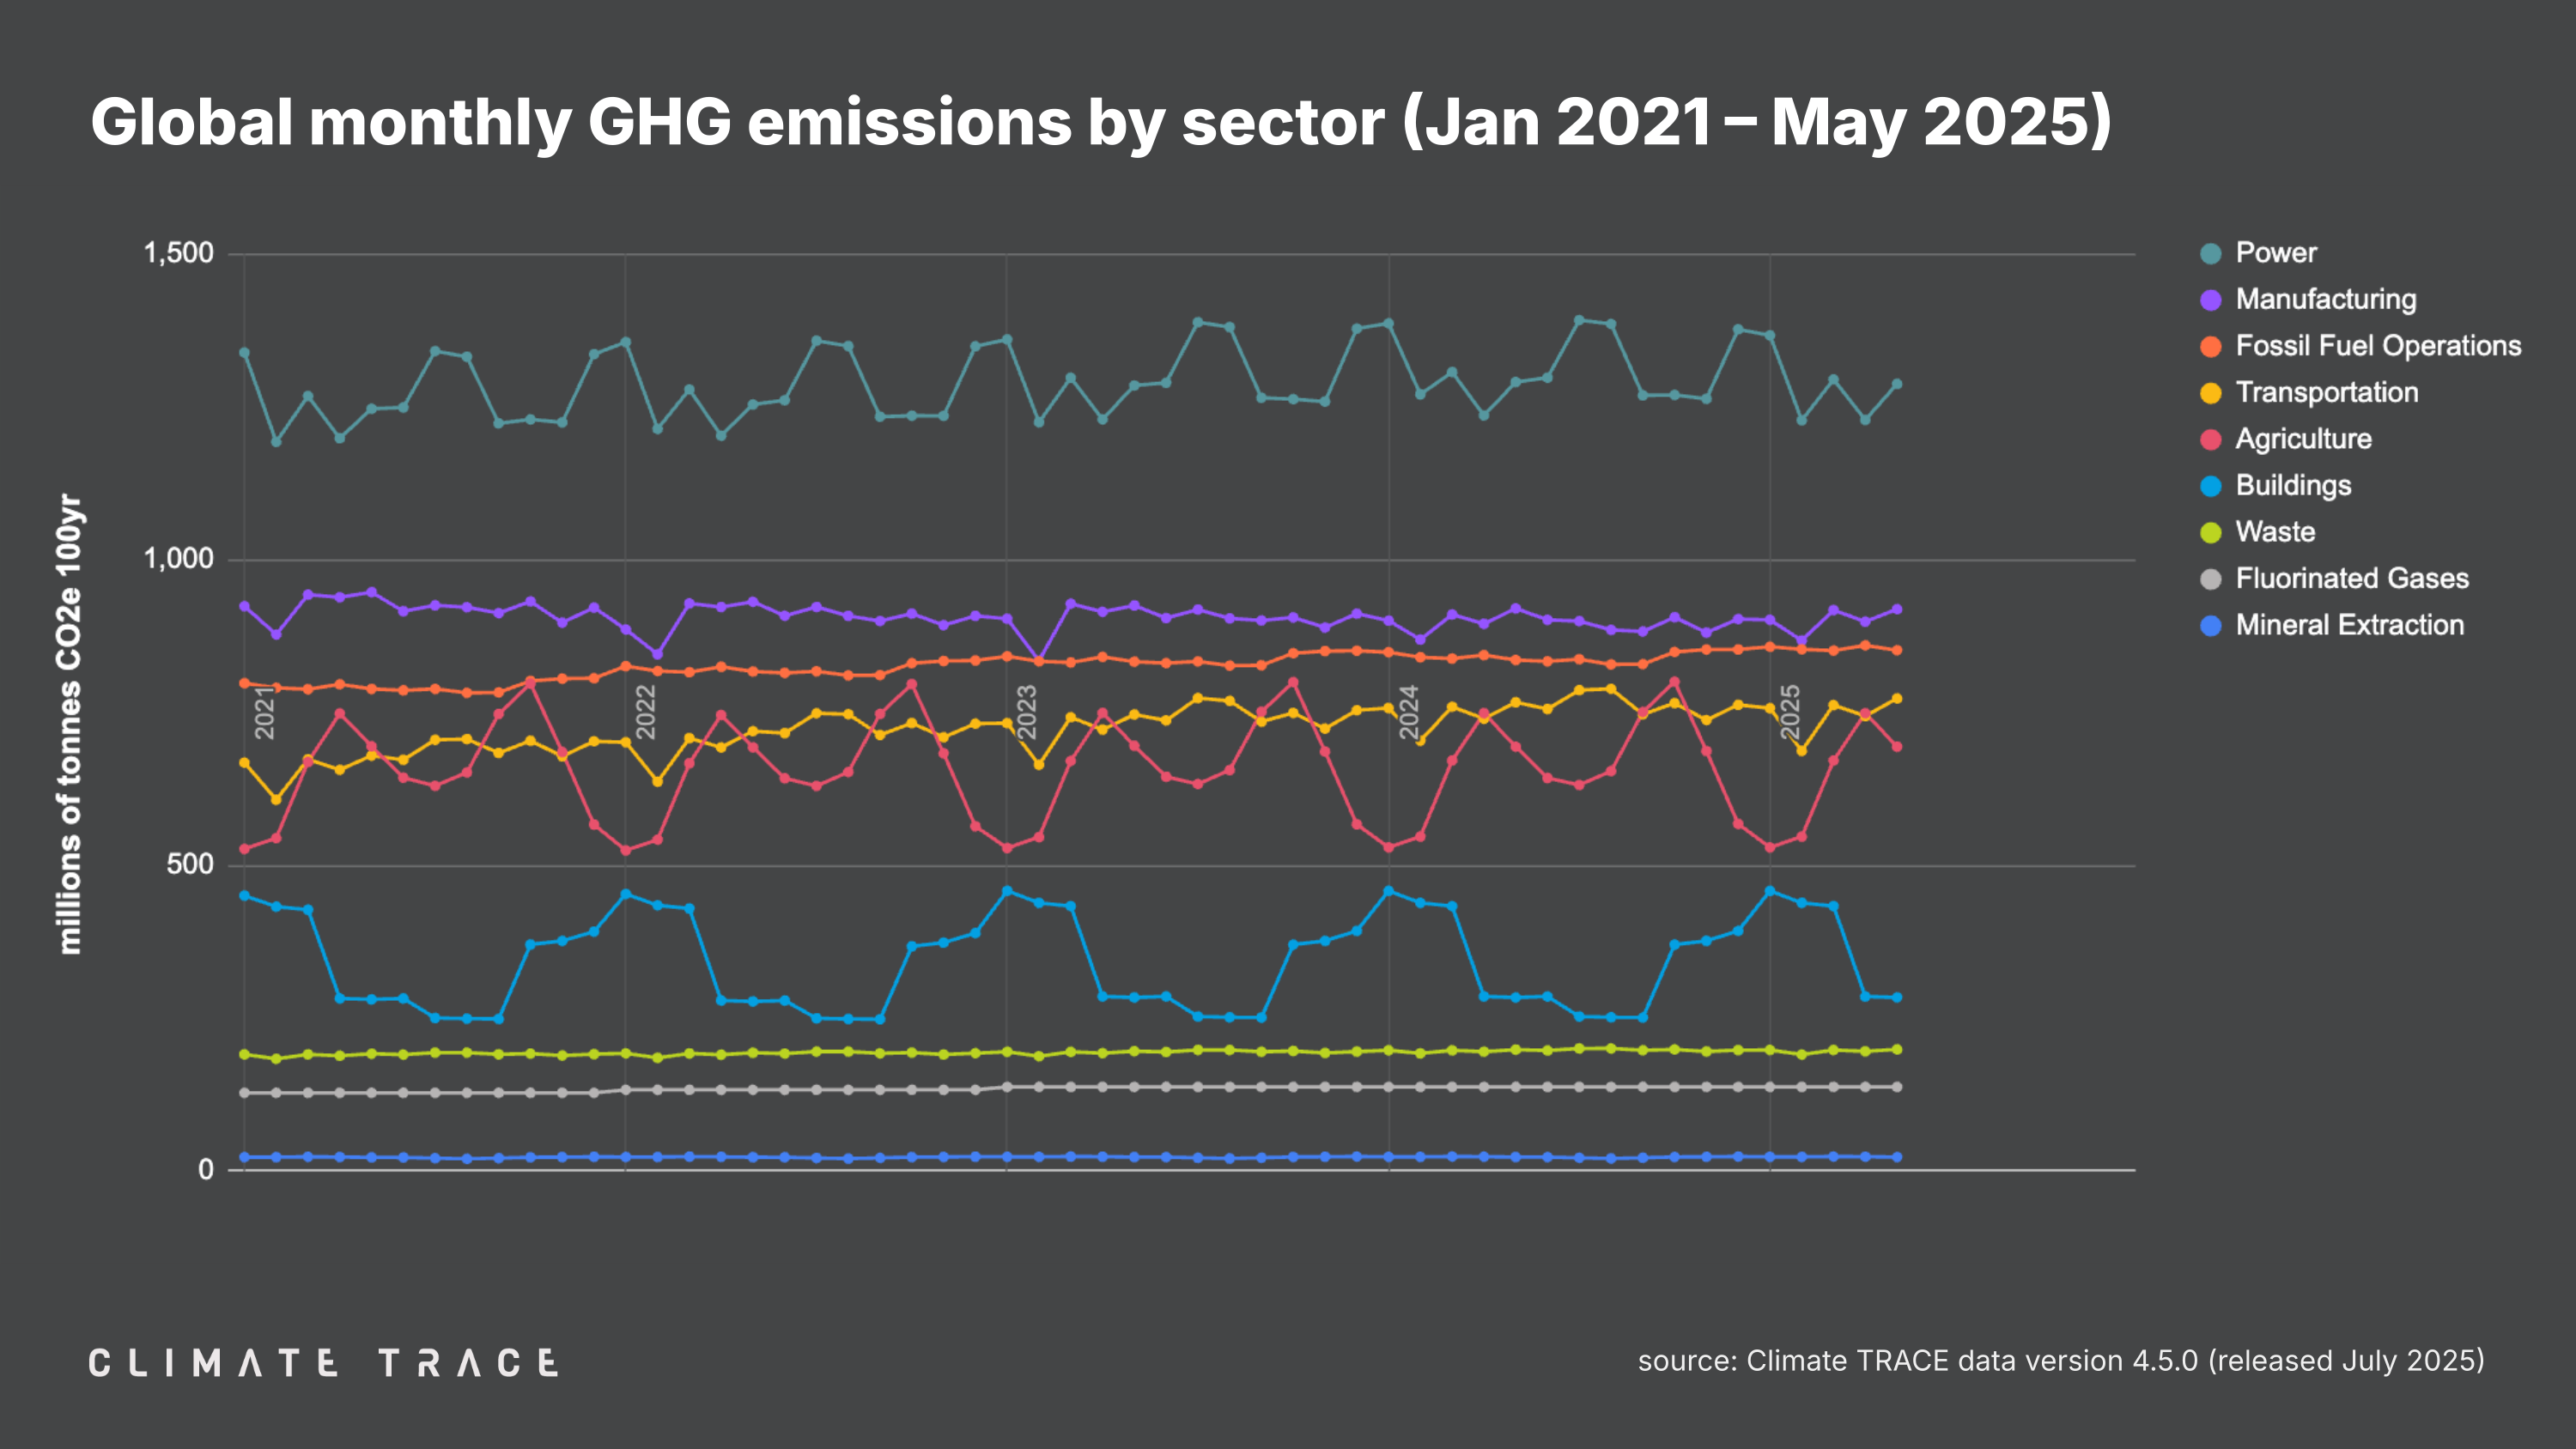
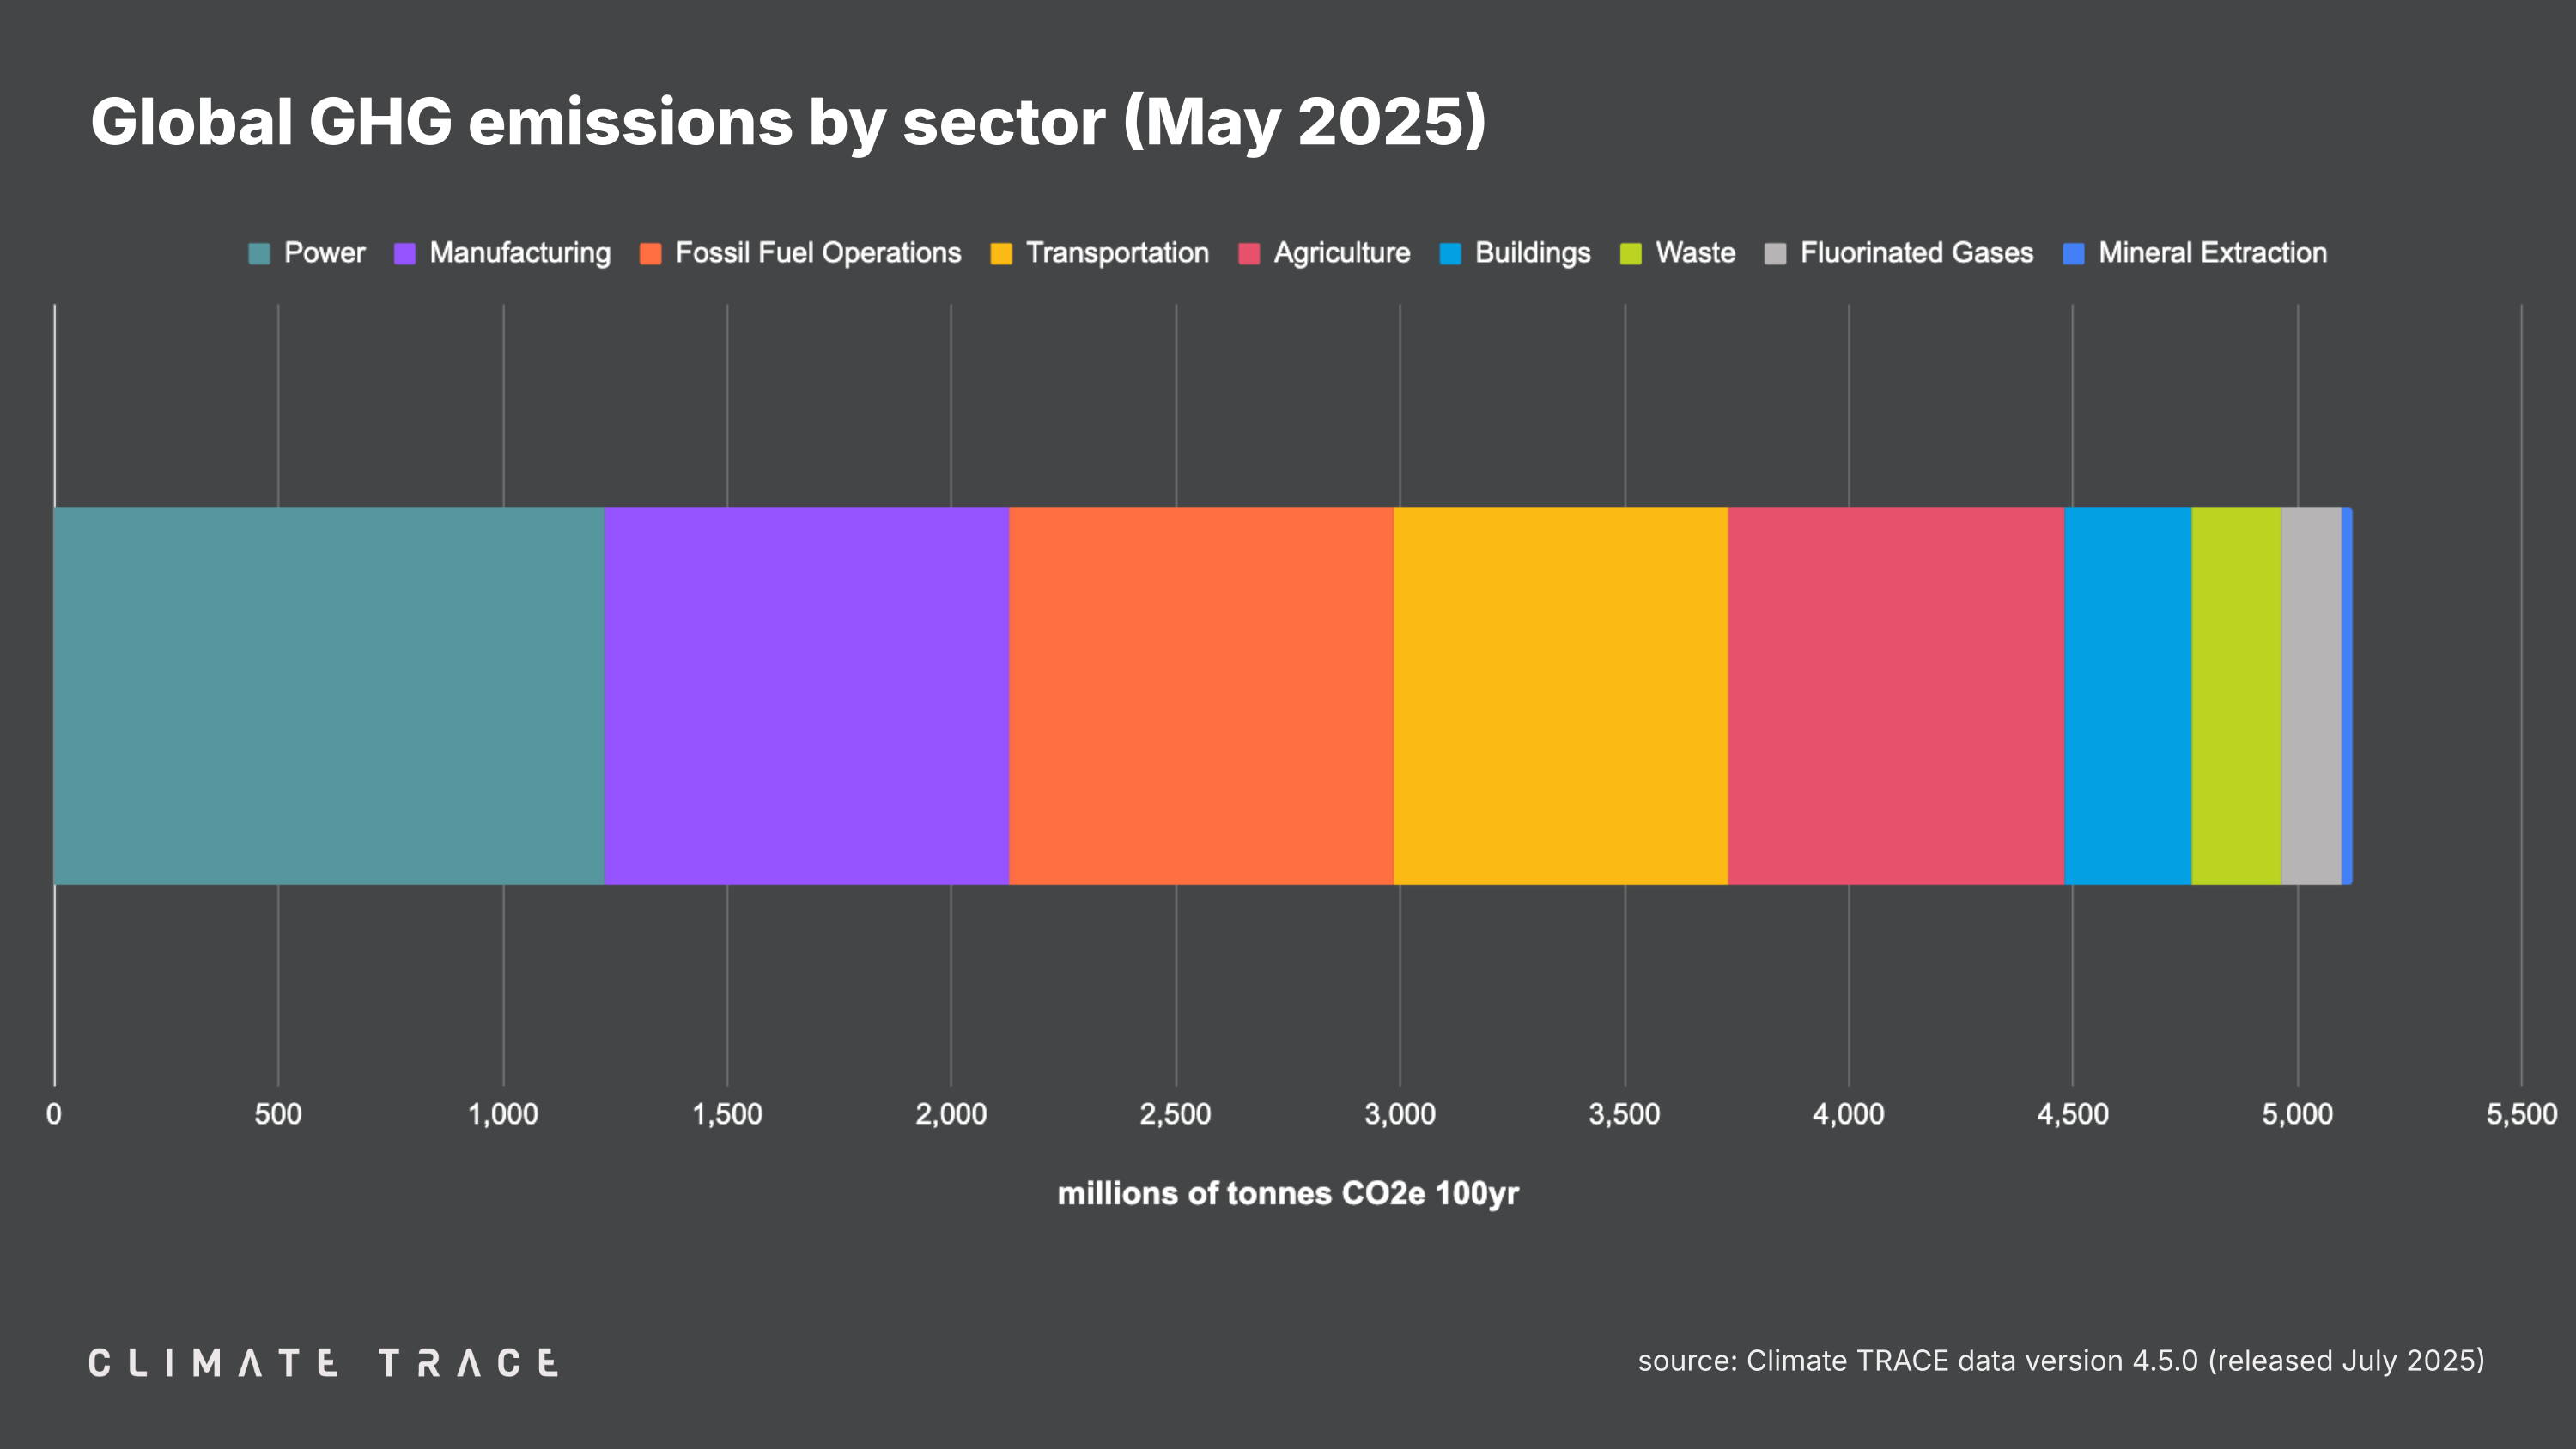
Greenhouse gas emissions increased year over year in fossil fuel operations, transportation, and waste, and decreased in manufacturing and power. Fossil fuel operations saw the greatest change in emissions year over year, with emissions increasing by 1.89%.
— Agriculture emissions were 693.99 million tonnes CO2e, unchanged vs. May 2024;
— Buildings emissions were 283.98 million tonnes CO2e, unchanged vs. May 2024;
— Fluorinated gases emissions were 137.71 million tonnes CO2e, unchanged vs. May 2024;
— Fossil fuel operations emissions were 851.59 million tonnes CO2e, a 1.89% increase vs. May 2024;
— Manufacturing emissions were 918.92 million tonnes CO2e, a 0.12% decrease vs. May 2024;
— Mineral extraction emissions were 22.99 million tonnes CO2e, unchanged vs. May 2024;
— Power emissions were 1,287.30 million tonnes CO2e, a 0.23% decrease vs. May 2024;
— Transportation emissions were 772.99 million tonnes CO2e, a 0.81% increase vs. May 2024;
— Waste emissions were 199.15 million tonnes CO2e, a 0.27% increase vs. May 2024.
Greenhouse Gas Emissions by City: May 2025
The urban areas with the highest total greenhouse gas emissions in May 2025 were Shanghai, China; Tokyo, Japan; New York, United States; Los Angeles, United States; and Houston, United States.
The urban areas with the greatest increase in absolute emissions year over year were Owensboro, United States; Pittsburgh, United States; Katowice, Poland; Dortmund, Germany; and Xinyu, China. Those with the largest absolute emissions decline were Swansea, United Kingdom; Singapore, Singapore; Tangshan, China; Houston, United States; and Anchorage, United States.
The urban areas with the greatest increase in emissions as a percentage of their total emissions were Tobelo, Indonesia; Kombissiri, Burkina Faso; Manzil Bourguiba, Tunisia; Porto Amboim, Angola; and Gambat, Pakistan. Those with the greatest decrease by percentage were Swansea, United Kingdom; Moroni, Comoros; Klaipėda, Lithuania; Shitang, China; and Kimbe, Papua New Guinea.
RELEASE NOTES
Revisions to existing Climate TRACE data are common and expected. They allow us to take the most up-to-date and accurate information into account. As new information becomes available, Climate TRACE will update its emissions totals (potentially including historical estimates) to reflect new data inputs, methodologies, and revisions.
With the addition of May 2025 data, the Climate TRACE database is now updated to version V4.5.0. This release introduced major improvements to cement sector data, which now includes information from Global Energy Monitor (GEM)’s Global Cement and Concrete Tracker, resulting in changes to global emissions totals, asset-level activity data, and emissions factors.
Additionally, all historical oil and gas production and transport data was updated with new modeling on lifecycle emissions and changes to input data sources.
Other updates include: the addition of monthly, country-level data for crop residues; the addition of Q1 2025 data in the following forestry subsectors: land clearing, land degradation, forest fires, shrubgrass fires, wetland fires, and through May 2025 for water reservoirs; the incorporation of improved spatial data for water reservoirs; the addition of Q3 2024 asset-level data for oil refineries and steam cracking petrochemical assets; and the addition of asset-level data for rice production in 15 countries.
A detailed description of data updates is available in our changelog here.
To learn more about what is included in our monthly data releases and for frequently asked questions, click here. All methodologies for Climate TRACE data estimates are available to view and download here. For any further technical questions about data updates, please contact: coalition@ClimateTRACE.org.
To sign up for monthly updates from Climate TRACE, click here.
Emissions data for June 2025 is scheduled for release on August 28, 2025.
About Climate TRACE
The Climate TRACE coalition was formed by a group of AI specialists, data scientists, researchers, and nongovernmental organizations. Current members include Carbon Yield; CTrees; Duke University’s Nicholas Institute for Energy, Environment & Sustainability; Earth Genome; Former Vice President Al Gore; Global Energy Monitor; Hypervine.io; Johns Hopkins University Applied Physics Lab; OceanMind; RMI; TransitionZero; and WattTime. Climate TRACE is also supported by more than 100 other contributing organizations and researchers, including key data and analysis contributors: Arboretica, Carnegie Mellon University’s CREATE Lab, Global Fishing Watch/emLab, Michigan State University, Open Supply Hub, and University of Malaysia Terengganu. For more information about the coalition and a list of contributors, click here.
Media Contacts
Fae Jencks and Nikki Arnone for Climate TRACE