Approach
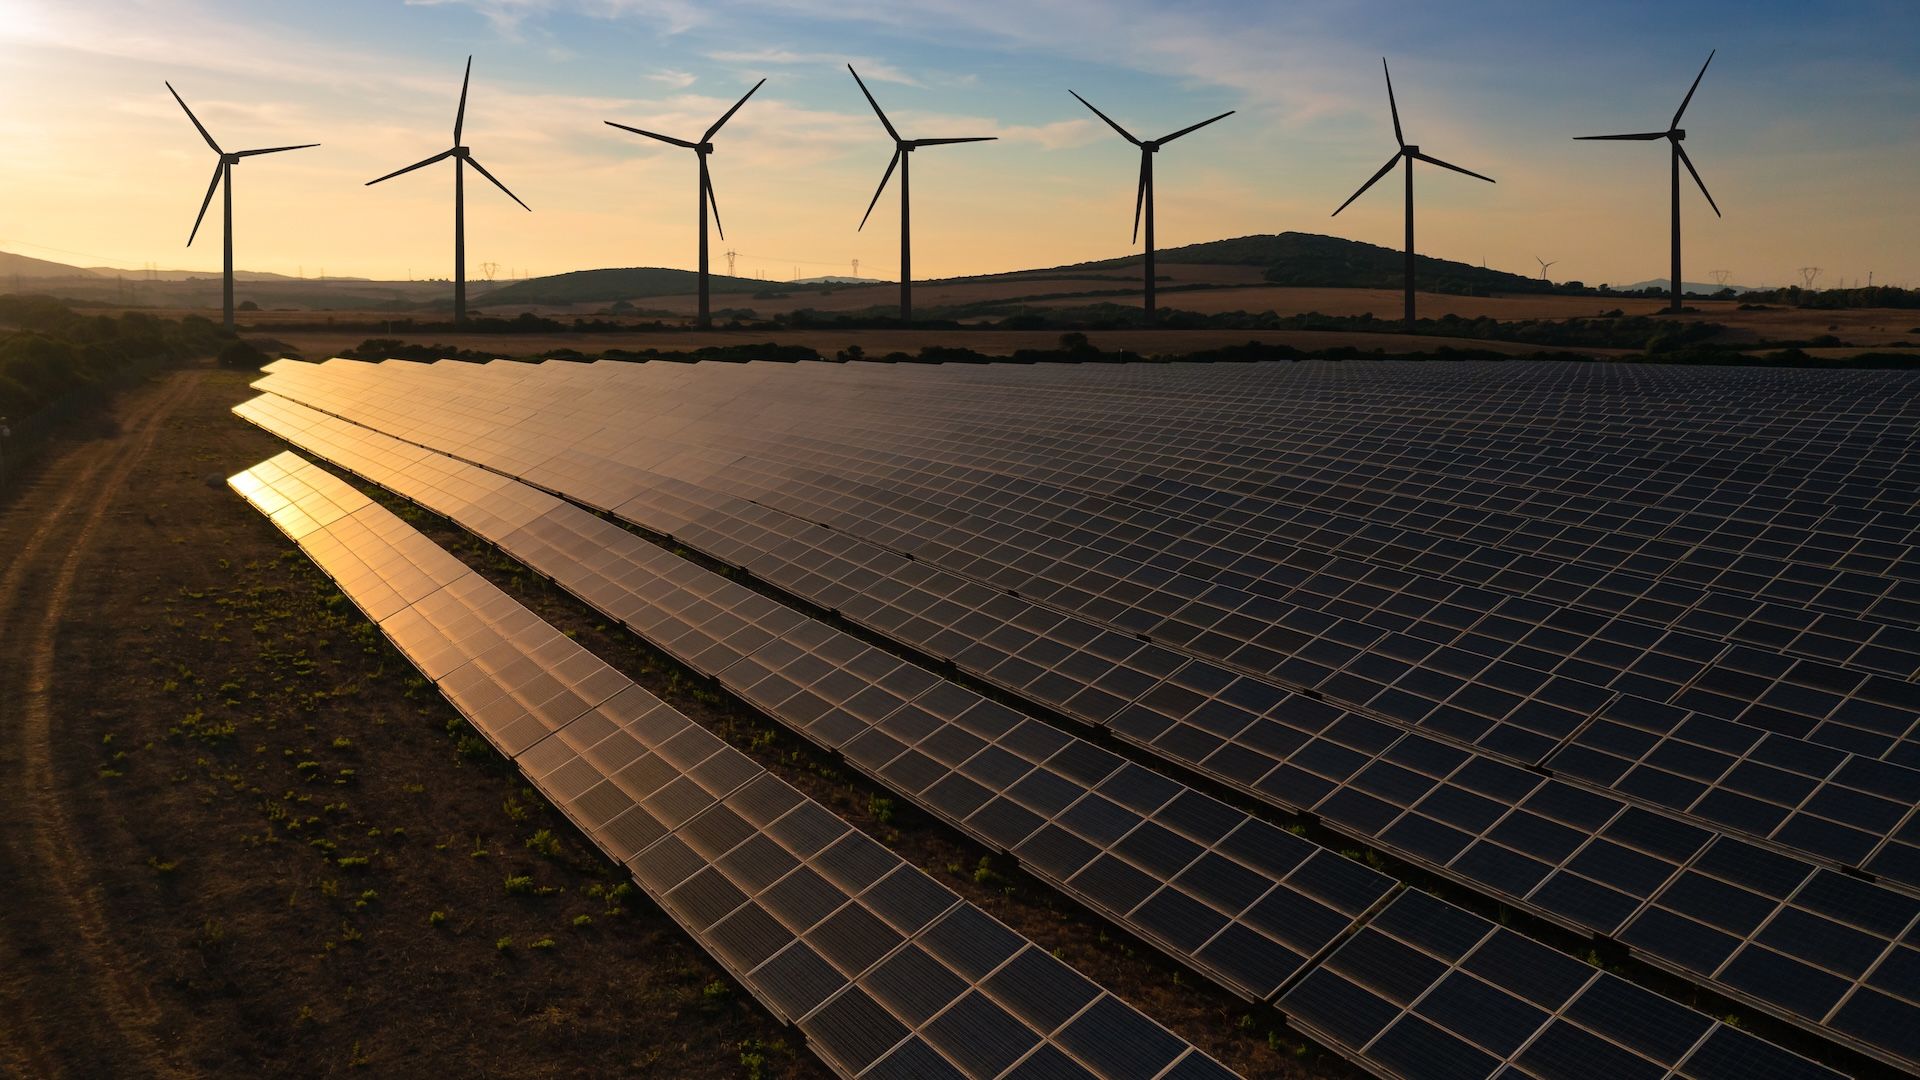
Every day, humanity pumps greenhouse gases and other pollutants into the Earth's atmosphere. Measuring those emissions starts with knowing where they’re coming from and what is causing them. So Climate TRACE identifies the locations of large sources and observes them over time.
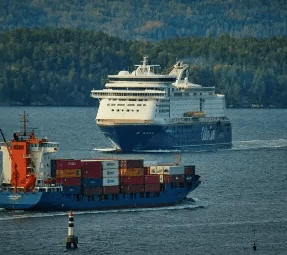

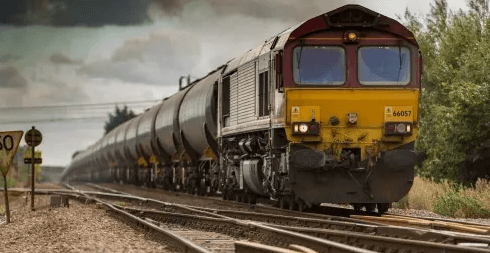

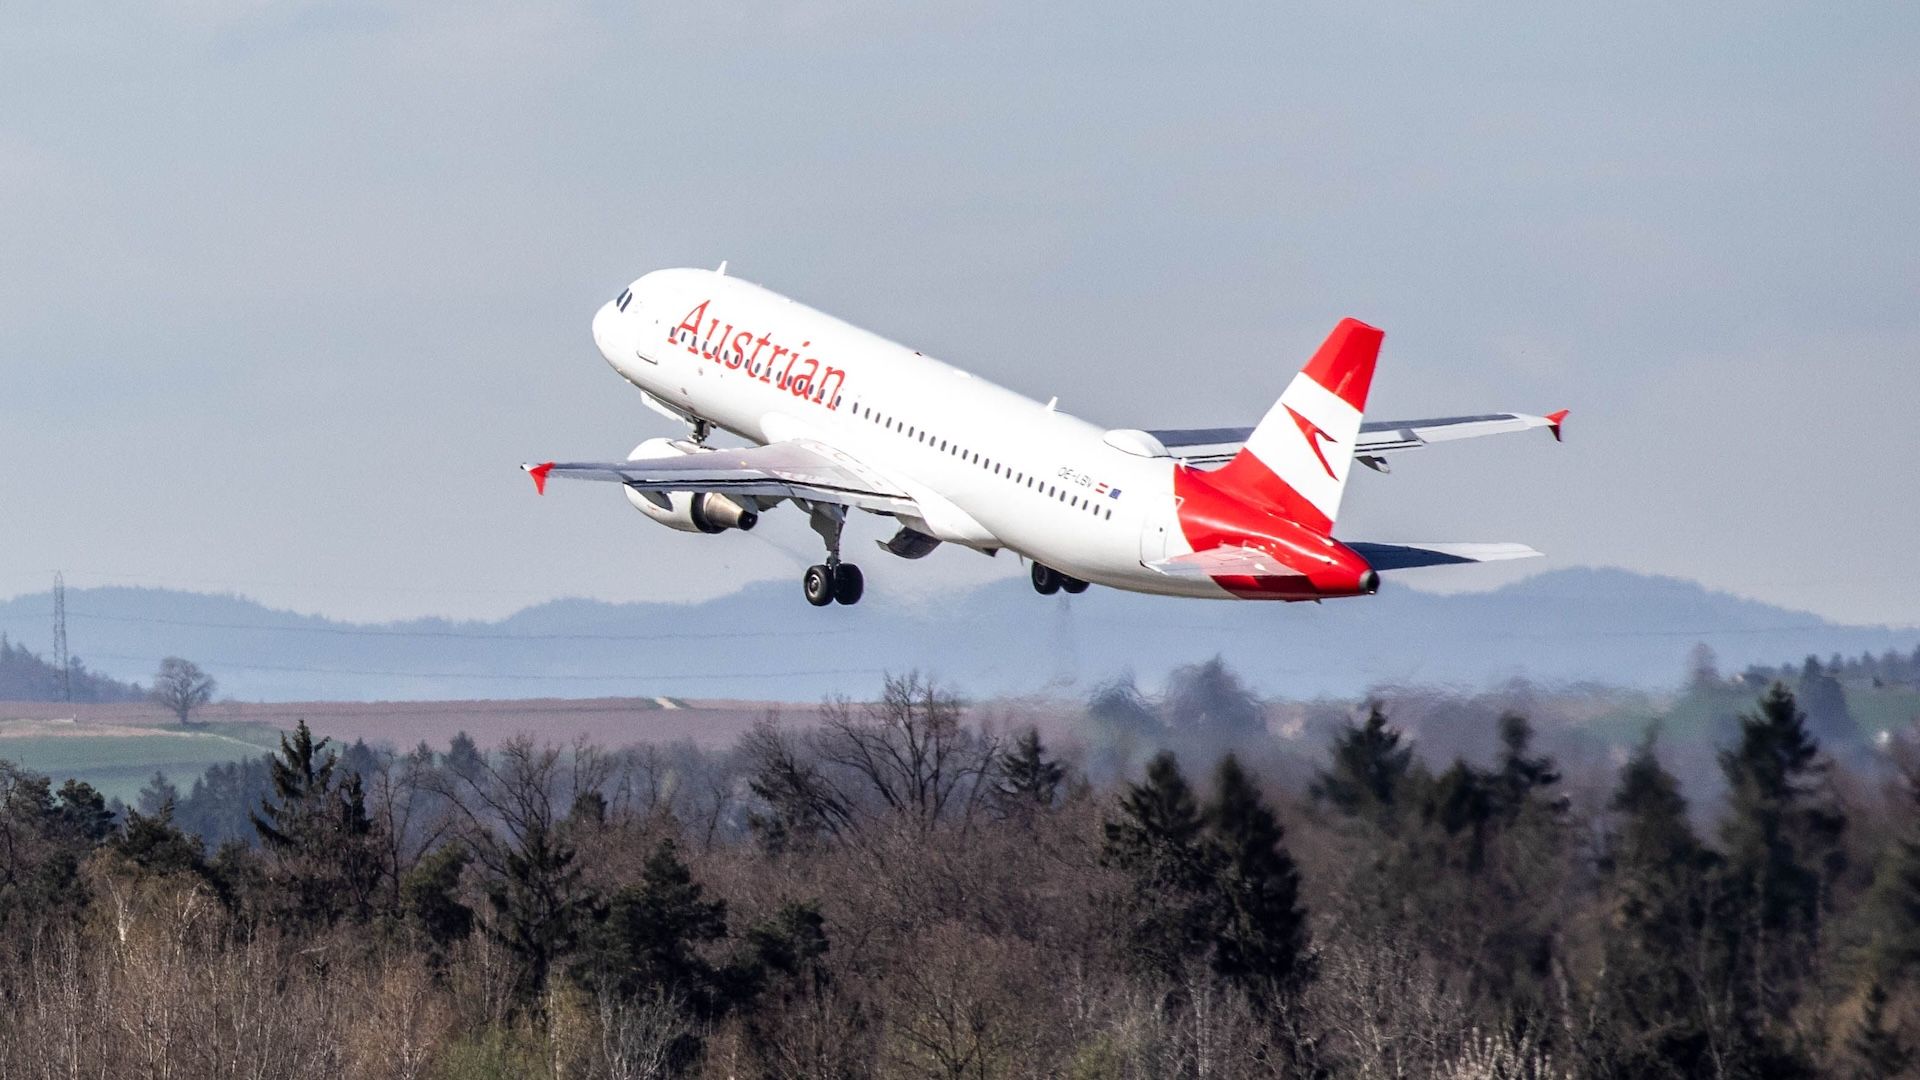
…not just the obvious things, like fossil-fueled power plants and factories, but also the tricky ones that move, such as ships and planes.
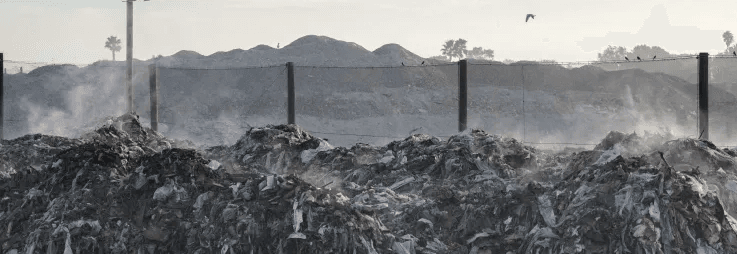
…as well as the less-obvious ones, like landfills and fields for rice cultivation.
We combine many sources of information, because the more we know about each emissions source, the better our dataset becomes.
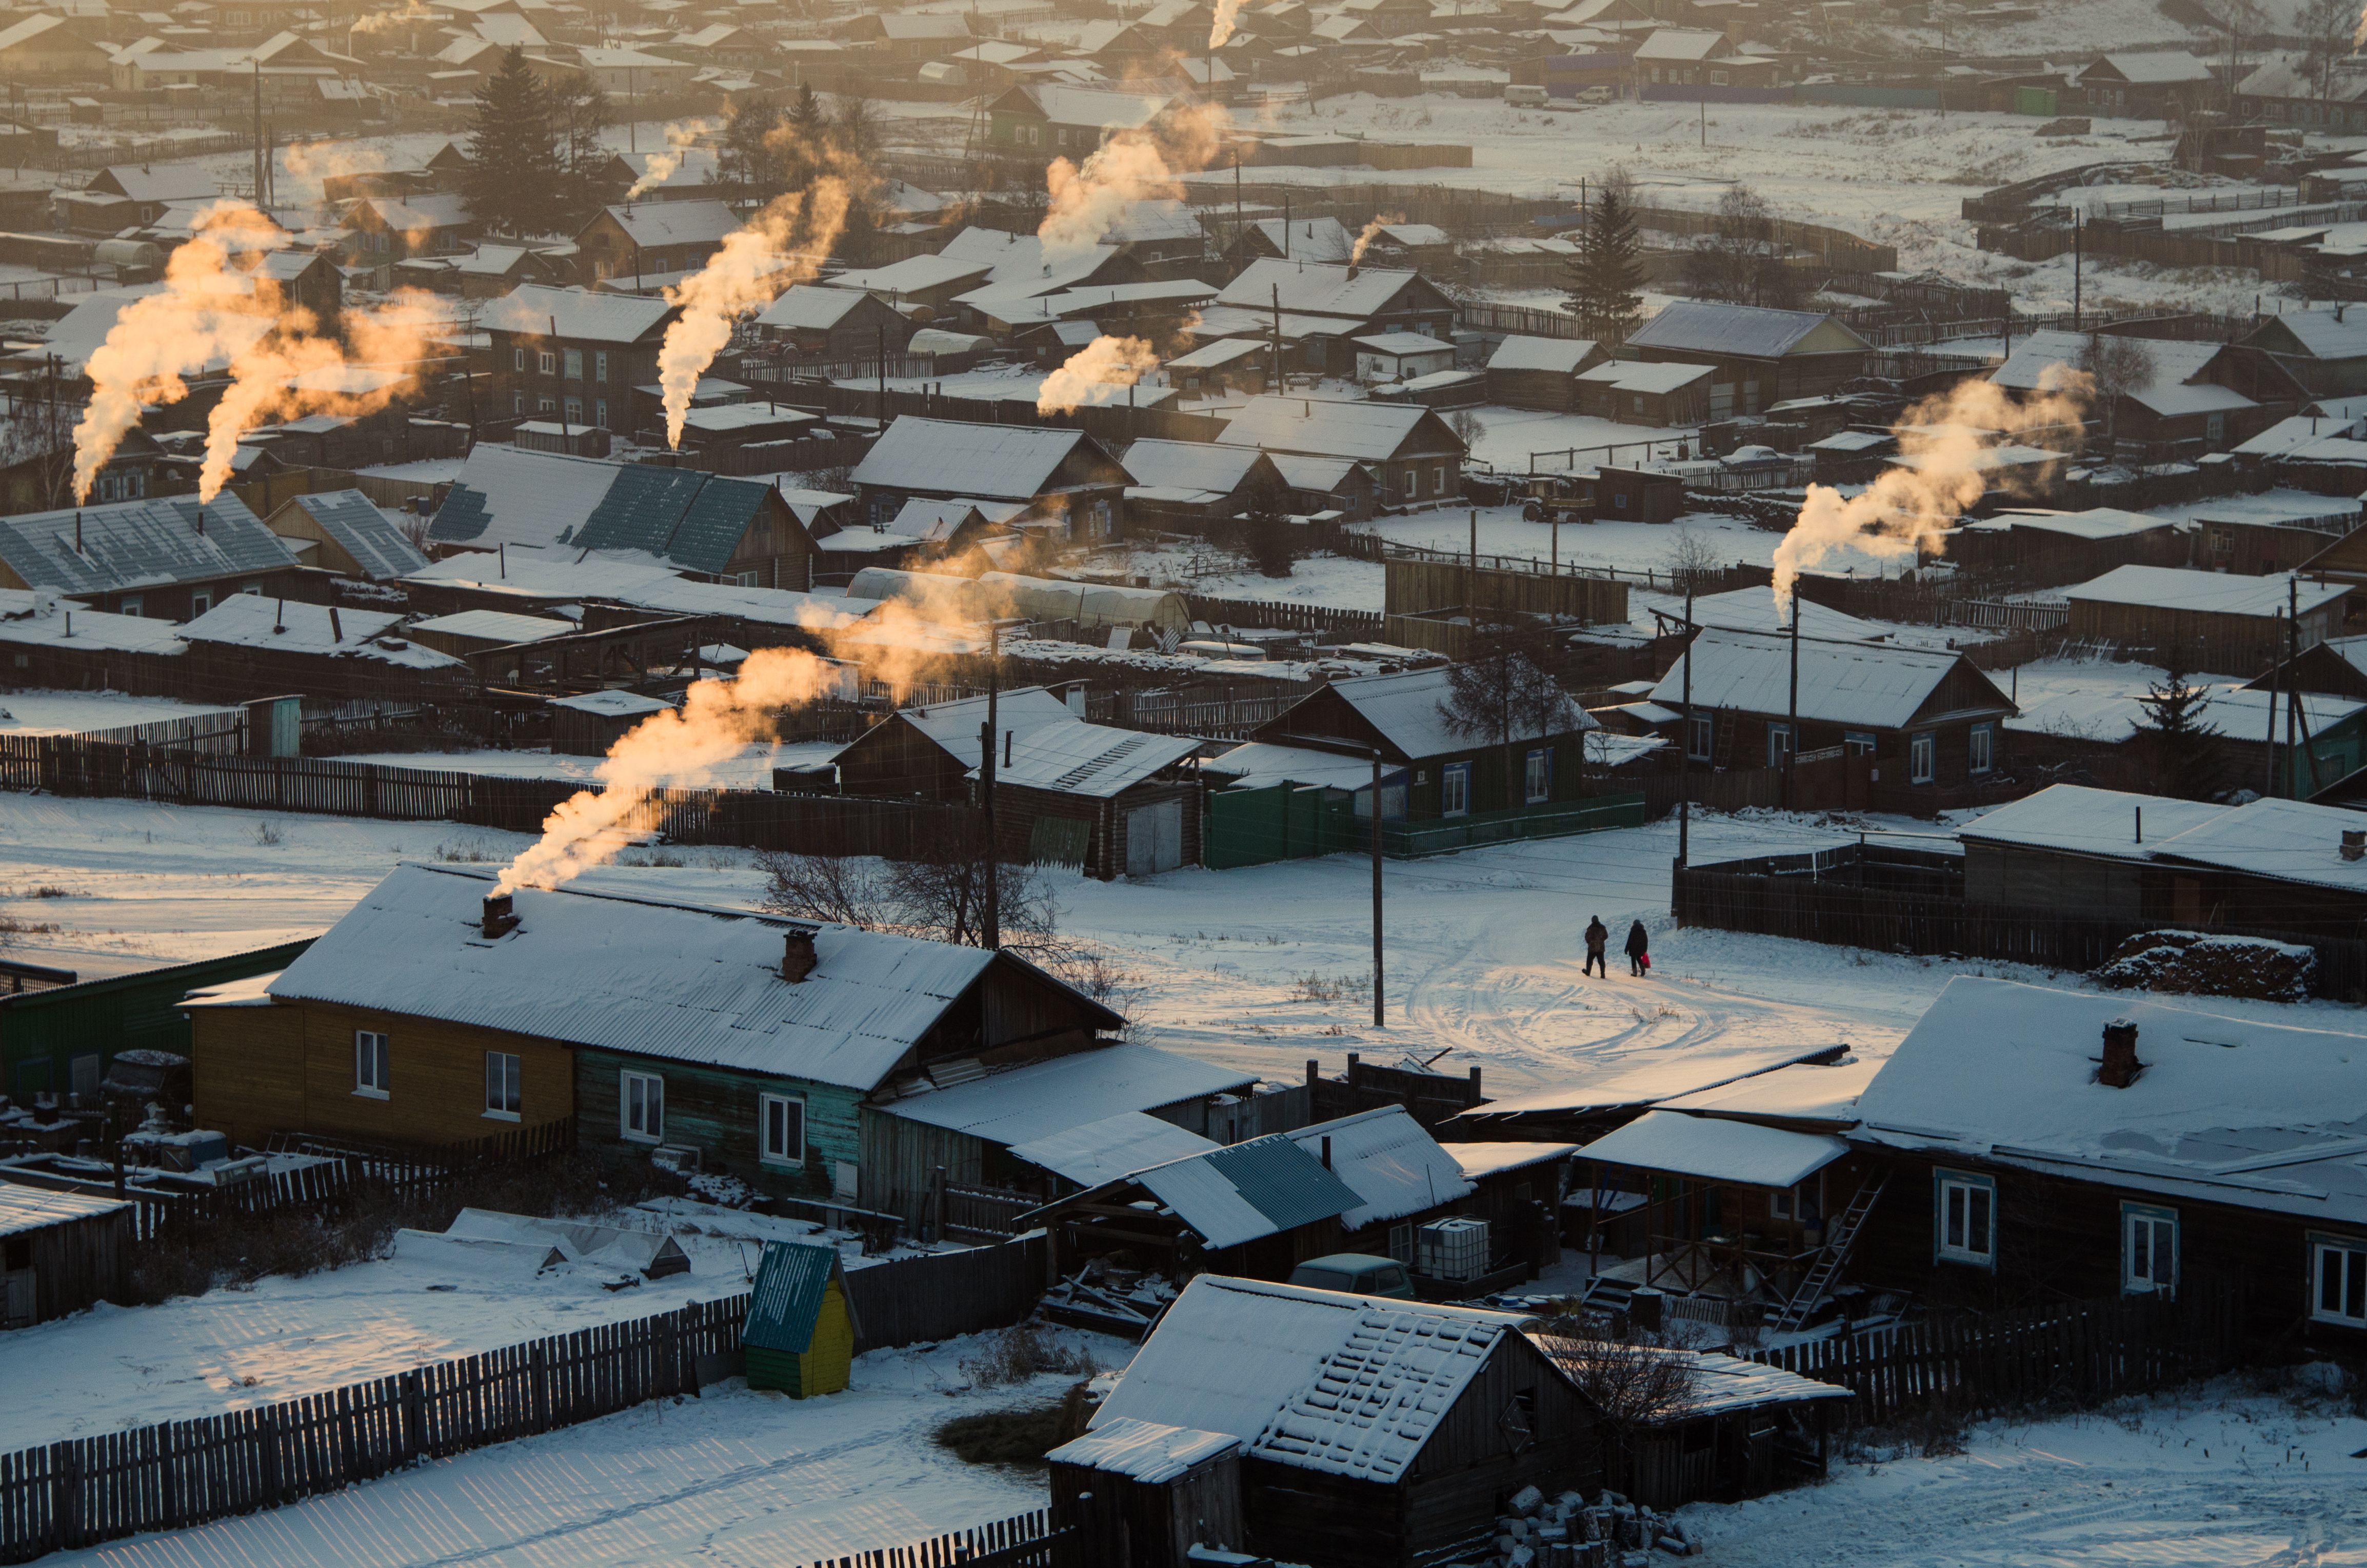
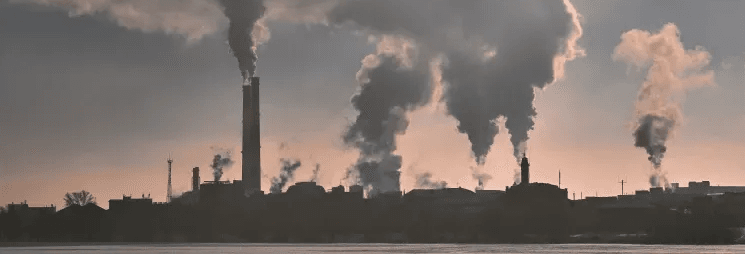
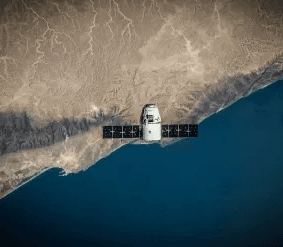
Satellite imagery is one important way that we document emissions-causing activities. We might see a smoke or water vapor plume from above.
Or a heat signature of a furnace from infrared imagery.
We assemble these observations on an ongoing basis, to understand how facilities change over time.
Then we gather what’s known as “ground truth” data (snippets of precisely measured emissions or activity from highly reliable sources such as on-the-ground sensors verified by a third party). The advantage of ground truth data is that they are highly accurate. But the disadvantage is that most emitting facilities worldwide don’t have such highly accurate data, or it can’t easily be verified by a third party.
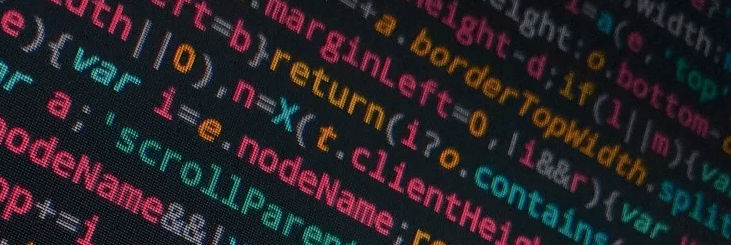
So, we then train artificial intelligence algorithms using satellite imagery of specific locations, paired with ground truth data about those locations. We only keep algorithms that pass our quality control measures (measured by how accurately they predict ground truth data).
Then we apply those high-quality algorithms to every other facility worldwide we can, so they can accurately translate the activity we’re seeing through satellite imagery and other approaches into quantified emissions estimates. We then use non-satellite based statistical models and meta-modeling based on other inventories for the rest of the facilities and sources.
That allows us to produce a detailed, timely, and independent global inventory of emissions from every country and territory and more than 745 million individual emitting facilities, farms, forests, and other assets.
With more and more information streaming in from space and from sensors around the globe, those emissions estimates are continuously improving.
Methods and Scientific Publications
A key purpose of Climate TRACE is empowering climate action through radical transparency. As part of our own commitment to transparency, we make full and detailed documentation of our methodologies available for download. Our work is also grounded in a commitment to scientific rigor. Documentation on the methodologies behind our emissions estimates for each sector as well as a comprehensive list of the peer-reviewed research that underlies our work is available on our GitHub page.
Contact us
Climate TRACE offers free data analysis and other support to select organizations, especially for high-impact use cases. Please contact us for support inquiries and consideration.